SPECpower_ssj2008
Host '0001' Performance Report
Copyright © 2007-2008 Standard Performance Evaluation Corporation
| Fujitsu Siemens Computers PRIMERGY RX300 S4 (Intel Xeon L5430) | ssj_ops@100% = 299,432 ssj_ops@100% per JVM = 74,858 |
||||
| Test Sponsor: | Fujitsu Siemens Computers | SPEC License #: | 22 | Test Method: | Single Node |
| Tested By: | Fujitsu Siemens Computers | Test Location: | Paderborn, NRW, Germany | Test Date: | Aug 20, 2008 |
| Hardware Availability: | Sep-2008 | Software Availability: | Jul-2008 | Publication: | Sep 10, 2008 |
| System Source: | Single Supplier | System Designation: | Server | Power Provisioning: | Line-powered |
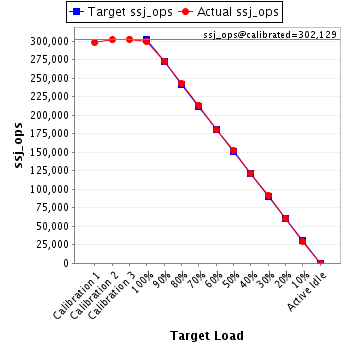
| Target Load | Actual Load | ssj_ops | |
|---|---|---|---|
| Target | Actual | ||
| Calibration 1 | 298,494 | ||
| Calibration 2 | 301,645 | ||
| Calibration 3 | 302,613 | ||
| ssj_ops@calibrated=302,129 | |||
| 100% | 99.1% | 302,129 | 299,432 |
| 90% | 90.3% | 271,916 | 272,807 |
| 80% | 80.4% | 241,703 | 242,910 |
| 70% | 70.6% | 211,490 | 213,244 |
| 60% | 59.6% | 181,278 | 180,156 |
| 50% | 50.5% | 151,065 | 152,621 |
| 40% | 40.1% | 120,852 | 121,076 |
| 30% | 30.3% | 90,639 | 91,454 |
| 20% | 20.0% | 60,426 | 60,366 |
| 10% | 9.9% | 30,213 | 29,972 |
| Active Idle | 0 | 0 | |
| Set Identifier: | sut |
| Set Description: | PRIMERGY RX300 S4 (Intel Xeon L5430) |
| # of Identical Nodes: | 1 |
| Comment: | None |
| Hardware | |
|---|---|
| Hardware Vendor: | Fujitsu Siemens Computers |
| Model: | PRIMERGY RX300 S4 (Intel Xeon L5430) |
| Form Factor: | -- |
| CPU Name: | Intel Xeon L5430 |
| CPU Characteristics: | 2.66GHz, 2x6MB L2 cache, 1333MHz system bus |
| CPU Frequency (MHz): | 2667 |
| CPU(s) Enabled: | 8 cores, 2 chips, 4 cores/chip |
| Hardware Threads: | 8 (1 / core) |
| CPU(s) Orderable: | 1,2 chips |
| Primary Cache: | 32 KB I + 32 KB D on chip per core |
| Secondary Cache: | 12 MB I+D on chip per chip, 6 MB shared / 2 cores |
| Tertiary Cache: | None |
| Other Cache: | None |
| Memory Amount (GB): | 8 |
| # and size of DIMM: | 4 x 2048 MB |
| Memory Details: | PC2-5300F 2Rx8 (CAS 5-5-5) |
| Power Supply Quantity and Rating (W): | 1 x 700 |
| Power Supply Details: | DPS-700KB B |
| Disk Drive: | 1 x Seagate (3.5", SATA, 160GB, 7.2krpm) |
| Disk Controller: | LSI Logic integrated SAS 3000 series, 8-port with 1068E |
| # and type of Network Interface Cards (NICs) Installed: | 2 x Broadcom BCM5708C NetXtreme II GigE (onboard) |
| NICs Enabled in Firmware / OS / Connected: | 1/1/1 |
| Network Speed (Mbit): | 1000 |
| Keyboard: | KVM |
| Mouse: | KVM |
| Monitor: | KVM |
| Optical Drives: | No |
| Other Hardware: | None |
| Software | |
|---|---|
| Power Management: | Enabled (Server Balanced Processor Power and Performance) |
| Operating System (OS): | Microsoft Windows Server 2003 R2 Enterprise x64 Edition |
| OS Version: | Version 5.2.3790 Service Pack 1 Build 3790 |
| Filesystem: | NTFS |
| JVM Vendor: | Oracle Corporation |
| JVM Version: | Oracle JRockit(R) 6.0 P27.5.0 (build P27.5.0-5_o_CR371811_CR374296-100684-1.6.0_03-20080702-1651-windows-x86_64) |
| JVM Command-line Options: | -Xms1700m -Xmx1700m -Xns1500m -XXaggressive -Xlargepages -Xgc:genpar -XXcallprofiling -XXgcthreads=2 -XXtlasize:min=4k,preferred=1024k -XXthroughputcompaction |
| JVM Affinity: | start /affinity [0x03,0x30,0x0C,0xC0] |
| JVM Instances: | 8 |
| JVM Initial Heap (MB): | 1700 |
| JVM Maximum Heap (MB): | 1700 |
| JVM Address Bits: | 64 |
| Boot Firmware Version: | -- |
| Management Firmware Version: | -- |
| Workload Version: | SSJ 1.1.3 |
| Director Location: | Controller |
| Other Software: | None |
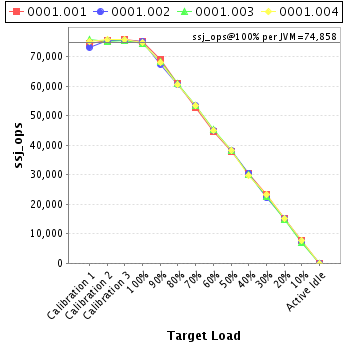
| JVM Instance | ssj_ops@100% |
|---|---|
| 0001.001 | 75,131 |
| 0001.002 | 75,072 |
| 0001.003 | 74,464 |
| 0001.004 | 74,764 |
| ssj_ops@100% | 299,432 |
| ssj_ops@100% per JVM | 74,858 |
| Target Load | Actual Load | ssj_ops | |
|---|---|---|---|
| Target | Actual | ||
| Calibration 1 | 74,477 | ||
| Calibration 2 | 75,506 | ||
| Calibration 3 | 75,935 | ||
| ssj_ops@calibrated=75,720 | |||
| 100% | 99.2% | 75,720 | 75,131 |
| 90% | 91.1% | 68,148 | 69,015 |
| 80% | 80.6% | 60,576 | 61,025 |
| 70% | 69.8% | 53,004 | 52,817 |
| 60% | 58.9% | 45,432 | 44,627 |
| 50% | 50.1% | 37,860 | 37,971 |
| 40% | 40.1% | 30,288 | 30,392 |
| 30% | 31.0% | 22,716 | 23,466 |
| 20% | 20.0% | 15,144 | 15,145 |
| 10% | 10.2% | 7,572 | 7,722 |
| Active Idle | 0 | 0 | |

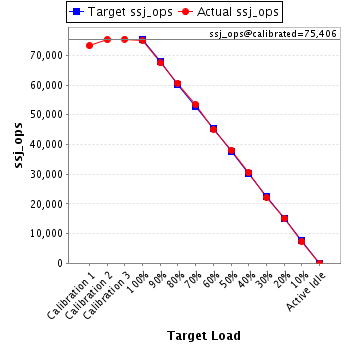
| Target Load | Actual Load | ssj_ops | |
|---|---|---|---|
| Target | Actual | ||
| Calibration 1 | 73,243 | ||
| Calibration 2 | 75,334 | ||
| Calibration 3 | 75,477 | ||
| ssj_ops@calibrated=75,406 | |||
| 100% | 99.6% | 75,406 | 75,072 |
| 90% | 89.5% | 67,865 | 67,456 |
| 80% | 80.4% | 60,324 | 60,647 |
| 70% | 71.0% | 52,784 | 53,550 |
| 60% | 59.8% | 45,243 | 45,118 |
| 50% | 50.5% | 37,703 | 38,112 |
| 40% | 40.5% | 30,162 | 30,567 |
| 30% | 29.4% | 22,622 | 22,161 |
| 20% | 20.0% | 15,081 | 15,087 |
| 10% | 9.8% | 7,541 | 7,379 |
| Active Idle | 0 | 0 | |
| Target Load | Actual Load | ssj_ops | |
|---|---|---|---|
| Target | Actual | ||
| Calibration 1 | 75,734 | ||
| Calibration 2 | 75,089 | ||
| Calibration 3 | 75,540 | ||
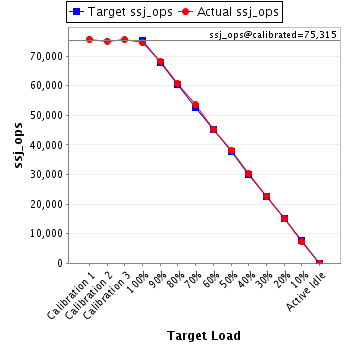
| ssj_ops@calibrated=75,315 | |||
| 100% | 98.9% | 75,315 | 74,464 |
| 90% | 90.7% | 67,783 | 68,291 |
| 80% | 80.7% | 60,252 | 60,759 |
| 70% | 71.0% | 52,720 | 53,502 |
| 60% | 60.1% | 45,189 | 45,292 |
| 50% | 50.7% | 37,657 | 38,166 |
| 40% | 40.1% | 30,126 | 30,216 |
| 30% | 30.1% | 22,594 | 22,691 |
| 20% | 19.9% | 15,063 | 14,977 |
| 10% | 9.6% | 7,531 | 7,204 |
| Active Idle | 0 | 0 | |
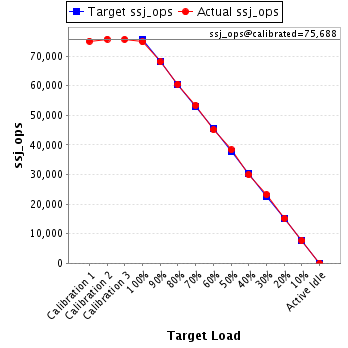
| Target Load | Actual Load | ssj_ops | |
|---|---|---|---|
| Target | Actual | ||
| Calibration 1 | 75,041 | ||
| Calibration 2 | 75,716 | ||
| Calibration 3 | 75,661 | ||
| ssj_ops@calibrated=75,688 | |||
| 100% | 98.8% | 75,688 | 74,764 |
| 90% | 89.9% | 68,120 | 68,045 |
| 80% | 79.9% | 60,551 | 60,479 |
| 70% | 70.5% | 52,982 | 53,375 |
| 60% | 59.6% | 45,413 | 45,120 |
| 50% | 50.7% | 37,844 | 38,372 |
| 40% | 39.5% | 30,275 | 29,901 |
| 30% | 30.6% | 22,707 | 23,136 |
| 20% | 20.0% | 15,138 | 15,158 |
| 10% | 10.1% | 7,569 | 7,668 |
| Active Idle | 0 | 0 | |