SPECpower_ssj2008
Host '0001' Performance Report
Copyright © 2007-2008 Standard Performance Evaluation Corporation
| Fujitsu Siemens Computers PRIMERGY TX300 S4 (Intel Xeon L5430) | ssj_ops@100% = 293,162 ssj_ops@100% per JVM = 73,291 |
||||
| Test Sponsor: | Fujitsu Siemens Computers | SPEC License #: | 22 | Test Method: | Single Node |
| Tested By: | Fujitsu Siemens Computers | Test Location: | Paderborn, NRW, Germany | Test Date: | Aug 25, 2008 |
| Hardware Availability: | Sep-2008 | Software Availability: | Jul-2008 | Publication: | Sep 10, 2008 |
| System Source: | Single Supplier | System Designation: | Server | Power Provisioning: | Line-powered |
| Target Load | Actual Load | ssj_ops | |
|---|---|---|---|
| Target | Actual | ||
| Calibration 1 | 291,534 | ||
| Calibration 2 | 293,467 | ||
| Calibration 3 | 295,892 | ||
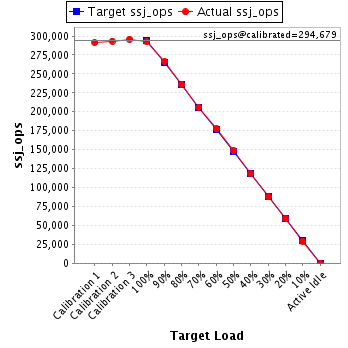
| ssj_ops@calibrated=294,679 | |||
| 100% | 99.5% | 294,679 | 293,162 |
| 90% | 90.4% | 265,212 | 266,476 |
| 80% | 80.0% | 235,744 | 235,772 |
| 70% | 69.9% | 206,276 | 206,037 |
| 60% | 60.4% | 176,808 | 177,897 |
| 50% | 50.5% | 147,340 | 148,910 |
| 40% | 40.1% | 117,872 | 118,259 |
| 30% | 29.7% | 88,404 | 87,530 |
| 20% | 20.0% | 58,936 | 58,791 |
| 10% | 10.0% | 29,468 | 29,361 |
| Active Idle | 0 | 0 | |
| Set Identifier: | sut |
| Set Description: | PRIMERGY TX300 S4 (Intel Xeon L5430) |
| # of Identical Nodes: | 1 |
| Comment: | None |
| Hardware | |
|---|---|
| Hardware Vendor: | Fujitsu Siemens Computers |
| Model: | PRIMERGY TX300 S4 (Intel Xeon L5430) |
| Form Factor: | -- |
| CPU Name: | Intel Xeon L5430 |
| CPU Characteristics: | 2.66GHz, 2x6MB L2 cache, 1333MHz system bus |
| CPU Frequency (MHz): | 2667 |
| CPU(s) Enabled: | 8 cores, 2 chips, 4 cores/chip |
| Hardware Threads: | 8 (1 / core) |
| CPU(s) Orderable: | 1,2 chips |
| Primary Cache: | 32 KB I + 32 KB D on chip per core |
| Secondary Cache: | 12 MB I+D on chip per chip, 6 MB shared / 2 cores |
| Tertiary Cache: | None |
| Other Cache: | None |
| Memory Amount (GB): | 8 |
| # and size of DIMM: | 4 x 2048 MB |
| Memory Details: | PC2-5300F 2Rx8 (CAS 5-5-5) |
| Power Supply Quantity and Rating (W): | 1 x 700 |
| Power Supply Details: | HIPRO HP-W700WC3 |
| Disk Drive: | 1 x Seagate (3.5", SATA, 160GB, 7.2krpm) |
| Disk Controller: | LSI Logic integrated SAS 3000 series, 8-port with 1068E |
| # and type of Network Interface Cards (NICs) Installed: | 2 x Broadcom BCM5708C NetXtreme II GigE (onboard) |
| NICs Enabled in Firmware / OS / Connected: | 1/1/1 |
| Network Speed (Mbit): | 1000 |
| Keyboard: | KVM |
| Mouse: | KVM |
| Monitor: | KVM |
| Optical Drives: | Yes |
| Other Hardware: | None |
| Software | |
|---|---|
| Power Management: | Enabled (Server Balanced Processor Power and Performance) |
| Operating System (OS): | Microsoft Windows Server 2003 R2 Enterprise x64 Edition |
| OS Version: | Version 5.2.3790 Service Pack 1 Build 3790 |
| Filesystem: | NTFS |
| JVM Vendor: | Oracle Corporation |
| JVM Version: | Oracle JRockit(R) 6.0 P27.5.0 (build P27.5.0-5_o_CR371811_CR374296-100684-1.6.0_03-20080702-1651-windows-x86_64) |
| JVM Command-line Options: | -Xms1700m -Xmx1700m -Xns1500m -XXaggressive -Xlargepages -Xgc:genpar -XXcallprofiling -XXgcthreads=2 -XXtlasize:min=4k,preferred=1024k -XXthroughputcompaction |
| JVM Affinity: | start /affinity [0x03,0x30,0x0C,0xC0] |
| JVM Instances: | 8 |
| JVM Initial Heap (MB): | 1700 |
| JVM Maximum Heap (MB): | 1700 |
| JVM Address Bits: | 64 |
| Boot Firmware Version: | -- |
| Management Firmware Version: | -- |
| Workload Version: | SSJ 1.1.3 |
| Director Location: | Controller |
| Other Software: | None |
| JVM Instance | ssj_ops@100% |
|---|---|
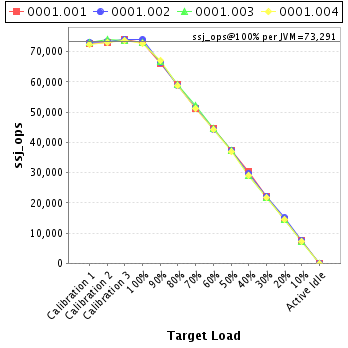
| 0001.001 | 73,152 |
| 0001.002 | 73,970 |
| 0001.003 | 73,221 |
| 0001.004 | 72,820 |
| ssj_ops@100% | 293,162 |
| ssj_ops@100% per JVM | 73,291 |
| Target Load | Actual Load | ssj_ops | |
|---|---|---|---|
| Target | Actual | ||
| Calibration 1 | 72,846 | ||
| Calibration 2 | 72,978 | ||
| Calibration 3 | 74,169 | ||
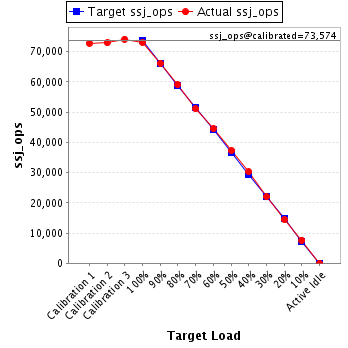
| ssj_ops@calibrated=73,574 | |||
| 100% | 99.4% | 73,574 | 73,152 |
| 90% | 90.0% | 66,216 | 66,214 |
| 80% | 80.4% | 58,859 | 59,121 |
| 70% | 69.4% | 51,501 | 51,076 |
| 60% | 60.6% | 44,144 | 44,570 |
| 50% | 50.7% | 36,787 | 37,311 |
| 40% | 41.1% | 29,429 | 30,265 |
| 30% | 29.9% | 22,072 | 22,019 |
| 20% | 19.7% | 14,715 | 14,499 |
| 10% | 10.4% | 7,357 | 7,616 |
| Active Idle | 0 | 0 | |
| Target Load | Actual Load | ssj_ops | |
|---|---|---|---|
| Target | Actual | ||
| Calibration 1 | 73,193 | ||
| Calibration 2 | 73,534 | ||
| Calibration 3 | 74,153 | ||
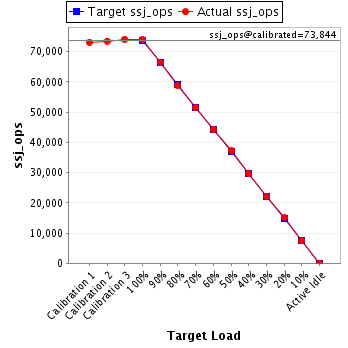
| ssj_ops@calibrated=73,844 | |||
| 100% | 100.2% | 73,844 | 73,970 |
| 90% | 90.1% | 66,459 | 66,558 |
| 80% | 79.8% | 59,075 | 58,893 |
| 70% | 69.9% | 51,691 | 51,581 |
| 60% | 59.9% | 44,306 | 44,252 |
| 50% | 50.5% | 36,922 | 37,276 |
| 40% | 40.1% | 29,537 | 29,585 |
| 30% | 29.9% | 22,153 | 22,070 |
| 20% | 20.4% | 14,769 | 15,068 |
| 10% | 10.0% | 7,384 | 7,400 |
| Active Idle | 0 | 0 | |
| Target Load | Actual Load | ssj_ops | |
|---|---|---|---|
| Target | Actual | ||
| Calibration 1 | 72,926 | ||
| Calibration 2 | 73,915 | ||
| Calibration 3 | 73,718 | ||
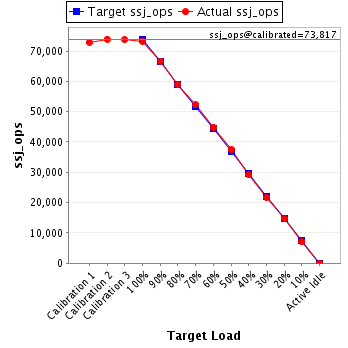
| ssj_ops@calibrated=73,817 | |||
| 100% | 99.2% | 73,817 | 73,221 |
| 90% | 90.3% | 66,435 | 66,686 |
| 80% | 80.0% | 59,053 | 59,032 |
| 70% | 70.8% | 51,672 | 52,239 |
| 60% | 60.6% | 44,290 | 44,707 |
| 50% | 50.7% | 36,908 | 37,456 |
| 40% | 39.6% | 29,527 | 29,198 |
| 30% | 29.4% | 22,145 | 21,714 |
| 20% | 19.8% | 14,763 | 14,620 |
| 10% | 9.6% | 7,382 | 7,066 |
| Active Idle | 0 | 0 | |
| Target Load | Actual Load | ssj_ops | |
|---|---|---|---|
| Target | Actual | ||
| Calibration 1 | 72,568 | ||
| Calibration 2 | 73,040 | ||
| Calibration 3 | 73,851 | ||
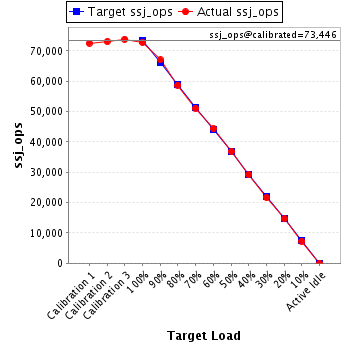
| ssj_ops@calibrated=73,446 | |||
| 100% | 99.1% | 73,446 | 72,820 |
| 90% | 91.2% | 66,101 | 67,018 |
| 80% | 80.0% | 58,757 | 58,726 |
| 70% | 69.6% | 51,412 | 51,141 |
| 60% | 60.4% | 44,067 | 44,369 |
| 50% | 50.2% | 36,723 | 36,866 |
| 40% | 39.8% | 29,378 | 29,211 |
| 30% | 29.6% | 22,034 | 21,727 |
| 20% | 19.9% | 14,689 | 14,604 |
| 10% | 9.9% | 7,345 | 7,279 |
| Active Idle | 0 | 0 | |