SPECpower_ssj2008
Host '0001' Performance Report
Copyright © 2007-2009 Standard Performance Evaluation Corporation
| Hewlett-Packard Company ProLiant DL785 G5 (2.30GHz, AMD Opteron 8376 HE) | ssj_ops@100% = 1,093,578 ssj_ops@100% per JVM = 136,697 |
||||
| Test Sponsor: | Hewlett-Packard Company | SPEC License #: | 3 | Test Method: | Single Node |
| Tested By: | Hewlett-Packard Company | Test Location: | Cupertino, CA, USA | Test Date: | Feb 6, 2009 |
| Hardware Availability: | Jan-2009 | Software Availability: | May-2009 | Publication: | Feb 25, 2009 |
| System Source: | Single Supplier | System Designation: | Server | Power Provisioning: | Line-powered |
| Target Load | Actual Load | ssj_ops | |
|---|---|---|---|
| Target | Actual | ||
| Calibration 1 | 1,109,699 | ||
| Calibration 2 | 1,101,459 | ||
| Calibration 3 | 1,104,865 | ||
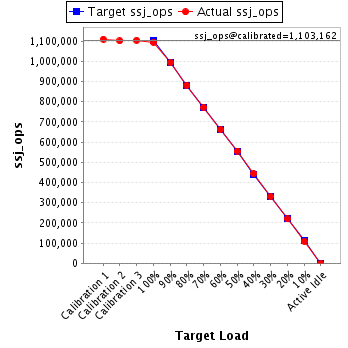
| ssj_ops@calibrated=1,103,162 | |||
| 100% | 99.1% | 1,103,162 | 1,093,578 |
| 90% | 90.1% | 992,846 | 994,044 |
| 80% | 80.0% | 882,530 | 882,297 |
| 70% | 70.0% | 772,214 | 771,909 |
| 60% | 60.1% | 661,897 | 663,054 |
| 50% | 50.4% | 551,581 | 555,606 |
| 40% | 40.3% | 441,265 | 444,226 |
| 30% | 29.9% | 330,949 | 329,372 |
| 20% | 19.9% | 220,632 | 219,469 |
| 10% | 9.9% | 110,316 | 109,134 |
| Active Idle | 0 | 0 | |
| Set Identifier: | sut |
| Set Description: | ProLiant DL785 G5 (2.30GHz, AMD Opteron 8376 HE) |
| # of Identical Nodes: | 1 |
| Comment: | None |
| Hardware | |
|---|---|
| Hardware Vendor: | Hewlett-Packard Company |
| Model: | ProLiant DL785 G5 (2.30GHz, AMD Opteron 8376 HE) |
| Form Factor: | -- |
| CPU Name: | Quad-Core AMD Opteron(r) Processor 8376 HE |
| CPU Characteristics: | Quad-Core, 2.3GHz, 6MB L3 Cache |
| CPU Frequency (MHz): | 2300 |
| CPU(s) Enabled: | 32 cores, 8 chips, 4 cores/chip |
| Hardware Threads: | 32 (1 / core) |
| CPU(s) Orderable: | 4,8 chips |
| Primary Cache: | 64 KB I + 64 KB D on chip per core |
| Secondary Cache: | 512 KB I+D on chip per chip |
| Tertiary Cache: | 6 MB I+D off chip per chip |
| Other Cache: | None |
| Memory Amount (GB): | 32 |
| # and size of DIMM: | 16 x 2048 MB |
| Memory Details: | 4GB Reg PC2-5300 2x2GB LP Kit 483401-B21; slots 1 and 2 populated on each board |
| Power Supply Quantity and Rating (W): | 3 x 1200 |
| Power Supply Details: | HP P/N 437572-B21 |
| Disk Drive: | 1 x 73GB 10K RPM SAS |
| Disk Controller: | Integrated P400i SmartArray controller |
| # and type of Network Interface Cards (NICs) Installed: | 2 x NC373i NIC |
| NICs Enabled in Firmware / OS / Connected: | 2/2/1 |
| Network Speed (Mbit): | 1000 |
| Keyboard: | KVM |
| Mouse: | KVM |
| Monitor: | None |
| Optical Drives: | Yes |
| Other Hardware: | none |
| Software | |
|---|---|
| Power Management: | HP Dynamic Power Regulator enabled |
| Operating System (OS): | Red Hat Enterprise Linux 5.3 |
| OS Version: | 2.6.18-128.el5 (64-bit) |
| Filesystem: | ext3 |
| JVM Vendor: | Oracle Corporation |
| JVM Version: | Oracle JRockit(R) 6 P28.0.0 (build P28.0.0-8-109238-1.6.0_05-20090130-1405-linux-x86_64, compiled mode) |
| JVM Command-line Options: | -Xms3600m -Xmx3600m -Xns3100m -XXaggressive -XlargePages -XXthroughputCompaction -XXcallprofiling -Xgc:genpar -XXgcthreads:4 -XXtlasize:min=12k,preferred=1024k |
| JVM Affinity: | numactl --membind=N --cpunodebind=N (N from 0 to 7) |
| JVM Instances: | 16 |
| JVM Initial Heap (MB): | 3600 |
| JVM Maximum Heap (MB): | 3600 |
| JVM Address Bits: | 64 |
| Boot Firmware Version: | -- |
| Management Firmware Version: | -- |
| Workload Version: | SSJ 1.1.3 |
| Director Location: | Controller |
| Other Software: | None |
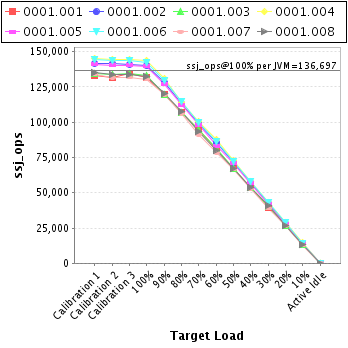
| JVM Instance | ssj_ops@100% |
|---|---|
| 0001.001 | 131,855 |
| 0001.002 | 140,348 |
| 0001.003 | 133,062 |
| 0001.004 | 143,733 |
| 0001.005 | 139,560 |
| 0001.006 | 142,109 |
| 0001.007 | 130,367 |
| 0001.008 | 132,544 |
| ssj_ops@100% | 1,093,578 |
| ssj_ops@100% per JVM | 136,697 |
| Target Load | Actual Load | ssj_ops | |
|---|---|---|---|
| Target | Actual | ||
| Calibration 1 | 133,163 | ||
| Calibration 2 | 131,930 | ||
| Calibration 3 | 134,541 | ||
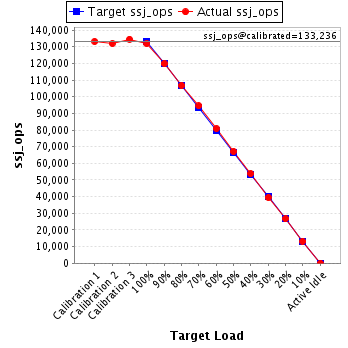
| ssj_ops@calibrated=133,236 | |||
| 100% | 99.0% | 133,236 | 131,855 |
| 90% | 89.9% | 119,912 | 119,758 |
| 80% | 80.1% | 106,588 | 106,760 |
| 70% | 70.9% | 93,265 | 94,493 |
| 60% | 60.7% | 79,941 | 80,855 |
| 50% | 50.4% | 66,618 | 67,206 |
| 40% | 40.4% | 53,294 | 53,804 |
| 30% | 29.6% | 39,971 | 39,424 |
| 20% | 20.0% | 26,647 | 26,641 |
| 10% | 9.9% | 13,324 | 13,234 |
| Active Idle | 0 | 0 | |
| Target Load | Actual Load | ssj_ops | |
|---|---|---|---|
| Target | Actual | ||
| Calibration 1 | 141,865 | ||
| Calibration 2 | 141,451 | ||
| Calibration 3 | 141,238 | ||
| ssj_ops@calibrated=141,344 | |||
| 100% | 99.3% | 141,344 | 140,348 |
| 90% | 90.6% | 127,210 | 128,016 |
| 80% | 80.3% | 113,075 | 113,433 |
| 70% | 70.2% | 98,941 | 99,266 |
| 60% | 60.3% | 84,807 | 85,299 |
| 50% | 50.3% | 70,672 | 71,091 |
| 40% | 40.3% | 56,538 | 56,949 |
| 30% | 30.0% | 42,403 | 42,449 |
| 20% | 19.9% | 28,269 | 28,154 |
| 10% | 9.7% | 14,134 | 13,741 |
| Active Idle | 0 | 0 | |

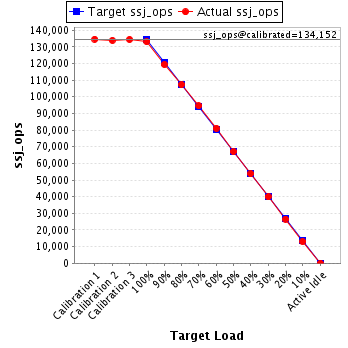
| Target Load | Actual Load | ssj_ops | |
|---|---|---|---|
| Target | Actual | ||
| Calibration 1 | 134,621 | ||
| Calibration 2 | 133,882 | ||
| Calibration 3 | 134,421 | ||
| ssj_ops@calibrated=134,152 | |||
| 100% | 99.2% | 134,152 | 133,062 |
| 90% | 89.0% | 120,736 | 119,421 |
| 80% | 79.9% | 107,321 | 107,241 |
| 70% | 70.5% | 93,906 | 94,563 |
| 60% | 60.5% | 80,491 | 81,110 |
| 50% | 50.0% | 67,076 | 67,071 |
| 40% | 40.0% | 53,661 | 53,696 |
| 30% | 29.7% | 40,245 | 39,899 |
| 20% | 19.8% | 26,830 | 26,567 |
| 10% | 9.7% | 13,415 | 13,049 |
| Active Idle | 0 | 0 | |
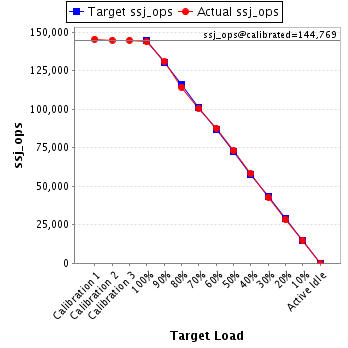
| Target Load | Actual Load | ssj_ops | |
|---|---|---|---|
| Target | Actual | ||
| Calibration 1 | 145,405 | ||
| Calibration 2 | 144,767 | ||
| Calibration 3 | 144,770 | ||
| ssj_ops@calibrated=144,769 | |||
| 100% | 99.3% | 144,769 | 143,733 |
| 90% | 90.3% | 130,292 | 130,669 |
| 80% | 78.9% | 115,815 | 114,277 |
| 70% | 69.6% | 101,338 | 100,723 |
| 60% | 60.6% | 86,861 | 87,717 |
| 50% | 50.4% | 72,384 | 72,928 |
| 40% | 40.2% | 57,907 | 58,175 |
| 30% | 29.6% | 43,431 | 42,806 |
| 20% | 19.7% | 28,954 | 28,564 |
| 10% | 10.2% | 14,477 | 14,782 |
| Active Idle | 0 | 0 | |
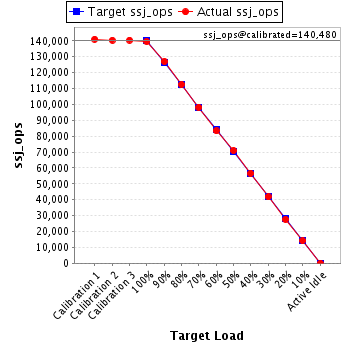
| Target Load | Actual Load | ssj_ops | |
|---|---|---|---|
| Target | Actual | ||
| Calibration 1 | 141,053 | ||
| Calibration 2 | 140,434 | ||
| Calibration 3 | 140,526 | ||
| ssj_ops@calibrated=140,480 | |||
| 100% | 99.3% | 140,480 | 139,560 |
| 90% | 90.4% | 126,432 | 126,997 |
| 80% | 80.1% | 112,384 | 112,556 |
| 70% | 69.9% | 98,336 | 98,231 |
| 60% | 59.3% | 84,288 | 83,334 |
| 50% | 50.5% | 70,240 | 70,940 |
| 40% | 40.3% | 56,192 | 56,620 |
| 30% | 29.8% | 42,144 | 41,802 |
| 20% | 19.7% | 28,096 | 27,639 |
| 10% | 10.1% | 14,048 | 14,193 |
| Active Idle | 0 | 0 | |
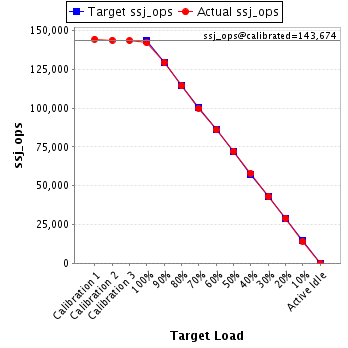
| Target Load | Actual Load | ssj_ops | |
|---|---|---|---|
| Target | Actual | ||
| Calibration 1 | 144,496 | ||
| Calibration 2 | 143,801 | ||
| Calibration 3 | 143,546 | ||
| ssj_ops@calibrated=143,674 | |||
| 100% | 98.9% | 143,674 | 142,109 |
| 90% | 90.1% | 129,306 | 129,481 |
| 80% | 79.6% | 114,939 | 114,414 |
| 70% | 69.5% | 100,572 | 99,900 |
| 60% | 59.9% | 86,204 | 86,017 |
| 50% | 50.3% | 71,837 | 72,314 |
| 40% | 40.4% | 57,469 | 57,981 |
| 30% | 29.9% | 43,102 | 42,953 |
| 20% | 20.1% | 28,735 | 28,863 |
| 10% | 9.8% | 14,367 | 14,103 |
| Active Idle | 0 | 0 | |
| Target Load | Actual Load | ssj_ops | |
|---|---|---|---|
| Target | Actual | ||
| Calibration 1 | 134,184 | ||
| Calibration 2 | 131,452 | ||
| Calibration 3 | 131,918 | ||
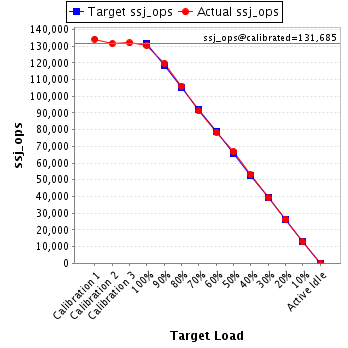
| ssj_ops@calibrated=131,685 | |||
| 100% | 99.0% | 131,685 | 130,367 |
| 90% | 90.8% | 118,516 | 119,585 |
| 80% | 80.6% | 105,348 | 106,120 |
| 70% | 69.2% | 92,179 | 91,189 |
| 60% | 59.6% | 79,011 | 78,508 |
| 50% | 50.7% | 65,842 | 66,740 |
| 40% | 40.2% | 52,674 | 52,942 |
| 30% | 29.7% | 39,505 | 39,161 |
| 20% | 20.1% | 26,337 | 26,428 |
| 10% | 9.8% | 13,168 | 12,849 |
| Active Idle | 0 | 0 | |
| Target Load | Actual Load | ssj_ops | |
|---|---|---|---|
| Target | Actual | ||
| Calibration 1 | 134,912 | ||
| Calibration 2 | 133,742 | ||
| Calibration 3 | 133,904 | ||
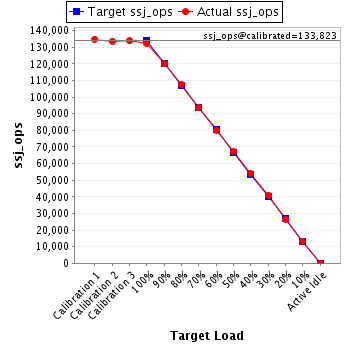
| ssj_ops@calibrated=133,823 | |||
| 100% | 99.0% | 133,823 | 132,544 |
| 90% | 89.8% | 120,441 | 120,118 |
| 80% | 80.3% | 107,059 | 107,496 |
| 70% | 69.9% | 93,676 | 93,544 |
| 60% | 59.9% | 80,294 | 80,214 |
| 50% | 50.3% | 66,912 | 67,316 |
| 40% | 40.4% | 53,529 | 54,058 |
| 30% | 30.5% | 40,147 | 40,879 |
| 20% | 19.9% | 26,765 | 26,611 |
| 10% | 9.9% | 13,382 | 13,183 |
| Active Idle | 0 | 0 | |