
SPECpower_ssj2008
Host '0001' Performance Report
Copyright © 2007-2009 Standard Performance Evaluation Corporation
| Hewlett-Packard Company ProLiant DL785 G5 (2.30GHz, AMD Opteron 8376 HE) | ssj_ops@100% = 1,066,480 ssj_ops@100% per JVM = 133,310 |
||||
| Test Sponsor: | Hewlett-Packard Company | SPEC License #: | 3 | Test Method: | Single Node |
| Tested By: | Hewlett-Packard Company | Test Location: | Cupertino, CA, USA | Test Date: | Feb 7, 2009 |
| Hardware Availability: | Jan-2009 | Software Availability: | May-2009 | Publication: | Feb 25, 2009 |
| System Source: | Single Supplier | System Designation: | Server | Power Provisioning: | Line-powered |
| Target Load | Actual Load | ssj_ops | |
|---|---|---|---|
| Target | Actual | ||
| Calibration 1 | 1,105,959 | ||
| Calibration 2 | 1,077,880 | ||
| Calibration 3 | 1,071,968 | ||
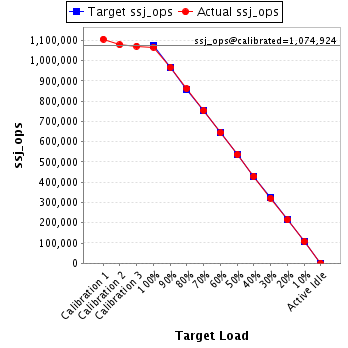
| ssj_ops@calibrated=1,074,924 | |||
| 100% | 99.2% | 1,074,924 | 1,066,480 |
| 90% | 89.9% | 967,432 | 966,782 |
| 80% | 80.2% | 859,939 | 862,108 |
| 70% | 70.1% | 752,447 | 753,080 |
| 60% | 59.9% | 644,954 | 644,152 |
| 50% | 49.9% | 537,462 | 536,172 |
| 40% | 40.0% | 429,970 | 429,488 |
| 30% | 29.9% | 322,477 | 321,499 |
| 20% | 19.9% | 214,985 | 214,366 |
| 10% | 10.1% | 107,492 | 108,242 |
| Active Idle | 0 | 0 | |
| Set Identifier: | sut |
| Set Description: | ProLiant DL785 G5 (2.30GHz, AMD Opteron 8376 HE) |
| # of Identical Nodes: | 1 |
| Comment: | None |
| Hardware | |
|---|---|
| Hardware Vendor: | Hewlett-Packard Company |
| Model: | ProLiant DL785 G5 (2.30GHz, AMD Opteron 8376 HE) |
| Form Factor: | -- |
| CPU Name: | Quad-Core AMD Opteron(r) Processor 8376 HE |
| CPU Characteristics: | Quad-Core, 2.3GHz, 6MB L3 Cache |
| CPU Frequency (MHz): | 2300 |
| CPU(s) Enabled: | 32 cores, 8 chips, 4 cores/chip |
| Hardware Threads: | 32 (1 / core) |
| CPU(s) Orderable: | 4,8 chips |
| Primary Cache: | 64 KB I + 64 KB D on chip per core |
| Secondary Cache: | 512 KB I+D on chip per chip |
| Tertiary Cache: | 6 MB I+D off chip per chip |
| Other Cache: | None |
| Memory Amount (GB): | 32 |
| # and size of DIMM: | 16 x 2048 MB |
| Memory Details: | 4GB Reg PC2-5300 2x2GB LP Kit 483401-B21; slots 1 and 2 populated on each board |
| Power Supply Quantity and Rating (W): | 3 x 1200 |
| Power Supply Details: | HP P/N 437572-B21 |
| Disk Drive: | 1 x 73GB 10K RPM SAS |
| Disk Controller: | Integrated P400i SmartArray controller |
| # and type of Network Interface Cards (NICs) Installed: | 2 x NC373i NIC |
| NICs Enabled in Firmware / OS / Connected: | 2/2/1 |
| Network Speed (Mbit): | 1000 |
| Keyboard: | KVM |
| Mouse: | KVM |
| Monitor: | None |
| Optical Drives: | Yes |
| Other Hardware: | none |
| Software | |
|---|---|
| Power Management: | HP Dynamic Power Regulator enabled |
| Operating System (OS): | Microsoft Windows Server 2008 x64 Enterprise Edition |
| OS Version: | Build 6001: Service pack 1 |
| Filesystem: | NTFS |
| JVM Vendor: | Oracle Corporation |
| JVM Version: | Oracle JRockit(R) 6 P28.0.0 (build P28.0.0-8-109238-1.6.0_05-20090130-1408-windows-x86_64, compiled mode) |
| JVM Command-line Options: | -Xms3600m -Xmx3600m -Xns3100m -XXaggressive -XlargePages -XXthroughputCompaction -XXcallprofiling -Xgc:genpar -XXgcthreads:4 -XXtlasize:min=12k,preferred=1024k |
| JVM Affinity: | Used "start /AFFINITY" "0xF","0xF0","0xF00","0xF000","0xF0000","0xF00000","0xF000000" and "0xF0000000" CPU masks. |
| JVM Instances: | 16 |
| JVM Initial Heap (MB): | 3600 |
| JVM Maximum Heap (MB): | 3600 |
| JVM Address Bits: | 64 |
| Boot Firmware Version: | -- |
| Management Firmware Version: | -- |
| Workload Version: | SSJ 1.1.3 |
| Director Location: | Controller |
| Other Software: | None |
| JVM Instance | ssj_ops@100% |
|---|---|
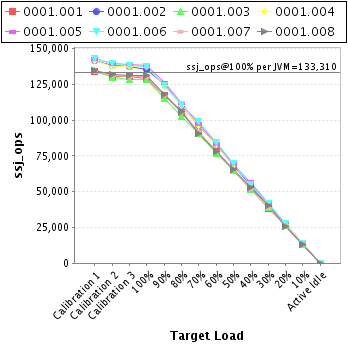
| 0001.001 | 129,126 |
| 0001.002 | 134,972 |
| 0001.003 | 128,111 |
| 0001.004 | 137,357 |
| 0001.005 | 138,107 |
| 0001.006 | 137,195 |
| 0001.007 | 130,228 |
| 0001.008 | 131,383 |
| ssj_ops@100% | 1,066,480 |
| ssj_ops@100% per JVM | 133,310 |
| Target Load | Actual Load | ssj_ops | |
|---|---|---|---|
| Target | Actual | ||
| Calibration 1 | 134,087 | ||
| Calibration 2 | 130,377 | ||
| Calibration 3 | 130,482 | ||
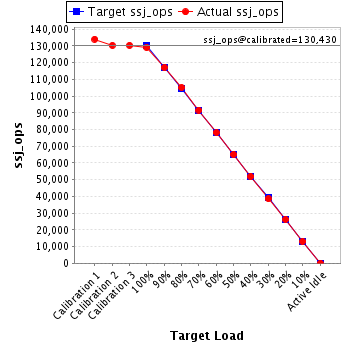
| ssj_ops@calibrated=130,430 | |||
| 100% | 99.0% | 130,430 | 129,126 |
| 90% | 89.8% | 117,387 | 117,136 |
| 80% | 80.6% | 104,344 | 105,148 |
| 70% | 70.3% | 91,301 | 91,628 |
| 60% | 60.0% | 78,258 | 78,210 |
| 50% | 49.9% | 65,215 | 65,101 |
| 40% | 39.8% | 52,172 | 51,922 |
| 30% | 29.6% | 39,129 | 38,580 |
| 20% | 20.2% | 26,086 | 26,297 |
| 10% | 10.0% | 13,043 | 13,070 |
| Active Idle | 0 | 0 | |
| Target Load | Actual Load | ssj_ops | |
|---|---|---|---|
| Target | Actual | ||
| Calibration 1 | 141,290 | ||
| Calibration 2 | 137,896 | ||
| Calibration 3 | 137,324 | ||
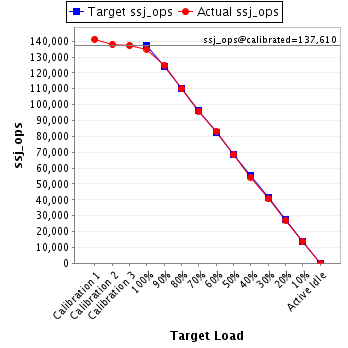
| ssj_ops@calibrated=137,610 | |||
| 100% | 98.1% | 137,610 | 134,972 |
| 90% | 90.8% | 123,849 | 124,903 |
| 80% | 79.9% | 110,088 | 109,976 |
| 70% | 69.7% | 96,327 | 95,974 |
| 60% | 60.4% | 82,566 | 83,178 |
| 50% | 49.7% | 68,805 | 68,380 |
| 40% | 39.4% | 55,044 | 54,216 |
| 30% | 29.6% | 41,283 | 40,739 |
| 20% | 19.8% | 27,522 | 27,248 |
| 10% | 9.9% | 13,761 | 13,673 |
| Active Idle | 0 | 0 | |
| Target Load | Actual Load | ssj_ops | |
|---|---|---|---|
| Target | Actual | ||
| Calibration 1 | 134,378 | ||
| Calibration 2 | 129,933 | ||
| Calibration 3 | 128,583 | ||
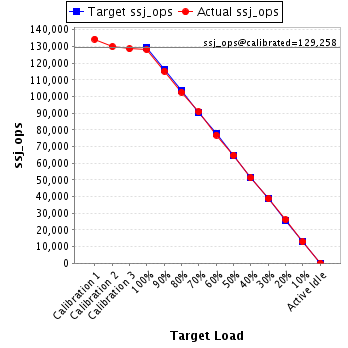
| ssj_ops@calibrated=129,258 | |||
| 100% | 99.1% | 129,258 | 128,111 |
| 90% | 89.2% | 116,332 | 115,240 |
| 80% | 79.4% | 103,406 | 102,621 |
| 70% | 70.2% | 90,481 | 90,794 |
| 60% | 59.5% | 77,555 | 76,897 |
| 50% | 50.1% | 64,629 | 64,747 |
| 40% | 39.6% | 51,703 | 51,229 |
| 30% | 30.0% | 38,777 | 38,773 |
| 20% | 20.2% | 25,852 | 26,124 |
| 10% | 10.0% | 12,926 | 12,932 |
| Active Idle | 0 | 0 | |
| Target Load | Actual Load | ssj_ops | |
|---|---|---|---|
| Target | Actual | ||
| Calibration 1 | 141,220 | ||
| Calibration 2 | 137,658 | ||
| Calibration 3 | 137,283 | ||
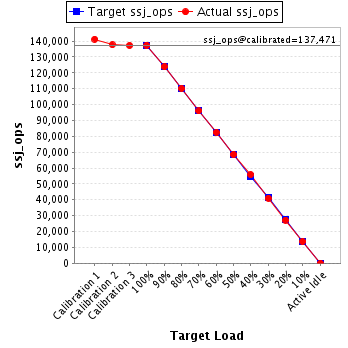
| ssj_ops@calibrated=137,471 | |||
| 100% | 99.9% | 137,471 | 137,357 |
| 90% | 90.1% | 123,724 | 123,815 |
| 80% | 80.2% | 109,977 | 110,227 |
| 70% | 69.8% | 96,230 | 95,975 |
| 60% | 60.1% | 82,483 | 82,583 |
| 50% | 49.9% | 68,735 | 68,530 |
| 40% | 40.6% | 54,988 | 55,876 |
| 30% | 29.8% | 41,241 | 41,027 |
| 20% | 19.8% | 27,494 | 27,256 |
| 10% | 10.0% | 13,747 | 13,744 |
| Active Idle | 0 | 0 | |
| Target Load | Actual Load | ssj_ops | |
|---|---|---|---|
| Target | Actual | ||
| Calibration 1 | 142,929 | ||
| Calibration 2 | 139,400 | ||
| Calibration 3 | 138,853 | ||
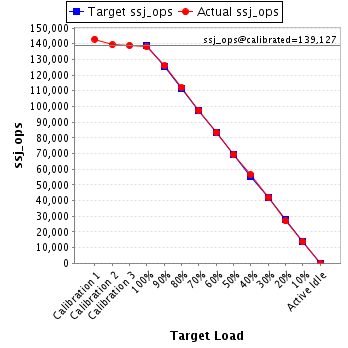
| ssj_ops@calibrated=139,127 | |||
| 100% | 99.3% | 139,127 | 138,107 |
| 90% | 90.6% | 125,214 | 126,065 |
| 80% | 80.4% | 111,301 | 111,824 |
| 70% | 70.0% | 97,389 | 97,378 |
| 60% | 59.9% | 83,476 | 83,372 |
| 50% | 49.7% | 69,563 | 69,176 |
| 40% | 40.6% | 55,651 | 56,517 |
| 30% | 30.1% | 41,738 | 41,936 |
| 20% | 19.4% | 27,825 | 26,986 |
| 10% | 9.8% | 13,913 | 13,696 |
| Active Idle | 0 | 0 | |
| Target Load | Actual Load | ssj_ops | |
|---|---|---|---|
| Target | Actual | ||
| Calibration 1 | 143,179 | ||
| Calibration 2 | 139,800 | ||
| Calibration 3 | 137,881 | ||
| ssj_ops@calibrated=138,840 | |||
| 100% | 98.8% | 138,840 | 137,195 |
| 90% | 89.6% | 124,956 | 124,424 |
| 80% | 79.9% | 111,072 | 110,876 |
| 70% | 71.2% | 97,188 | 98,792 |
| 60% | 60.5% | 83,304 | 84,064 |
| 50% | 50.0% | 69,420 | 69,474 |
| 40% | 39.5% | 55,536 | 54,873 |
| 30% | 29.9% | 41,652 | 41,464 |
| 20% | 20.1% | 27,768 | 27,887 |
| 10% | 10.1% | 13,884 | 13,966 |
| Active Idle | 0 | 0 | |

| Target Load | Actual Load | ssj_ops | |
|---|---|---|---|
| Target | Actual | ||
| Calibration 1 | 134,101 | ||
| Calibration 2 | 130,979 | ||
| Calibration 3 | 130,168 | ||
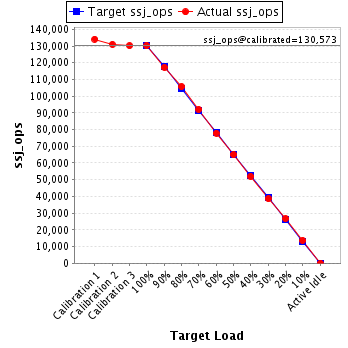
| ssj_ops@calibrated=130,573 | |||
| 100% | 99.7% | 130,573 | 130,228 |
| 90% | 89.8% | 117,516 | 117,235 |
| 80% | 81.0% | 104,459 | 105,702 |
| 70% | 70.5% | 91,401 | 92,106 |
| 60% | 59.7% | 78,344 | 77,910 |
| 50% | 49.8% | 65,287 | 64,968 |
| 40% | 39.8% | 52,229 | 51,915 |
| 30% | 29.5% | 39,172 | 38,579 |
| 20% | 20.5% | 26,115 | 26,747 |
| 10% | 10.5% | 13,057 | 13,715 |
| Active Idle | 0 | 0 | |
| Target Load | Actual Load | ssj_ops | |
|---|---|---|---|
| Target | Actual | ||
| Calibration 1 | 134,775 | ||
| Calibration 2 | 131,836 | ||
| Calibration 3 | 131,394 | ||
| ssj_ops@calibrated=131,615 | |||
| 100% | 99.8% | 131,615 | 131,383 |
| 90% | 89.6% | 118,453 | 117,964 |
| 80% | 80.3% | 105,292 | 105,733 |
| 70% | 68.7% | 92,130 | 90,433 |
| 60% | 59.2% | 78,969 | 77,937 |
| 50% | 50.0% | 65,807 | 65,796 |
| 40% | 40.2% | 52,646 | 52,940 |
| 30% | 30.7% | 39,484 | 40,401 |
| 20% | 19.6% | 26,323 | 25,819 |
| 10% | 10.2% | 13,161 | 13,446 |
| Active Idle | 0 | 0 | |
