SPECpower_ssj2008
Host '0001' Performance Report
Copyright © 2007-2009 Standard Performance Evaluation Corporation
| Fujitsu Siemens Computers PRIMERGY TX300 S4 (Intel Xeon L5430) | ssj_ops@100% = 326,264 ssj_ops@100% per JVM = 81,566 |
||||
| Test Sponsor: | Fujitsu Siemens Computers | SPEC License #: | 22 | Test Method: | Single Node |
| Tested By: | Fujitsu Siemens Computers | Test Location: | Paderborn, NRW, Germany | Test Date: | 19.02.2009 |
| Hardware Availability: | Sep-2008 | Software Availability: | May-2009 | Publication: | Mar 11, 2009 |
| System Source: | Single Supplier | System Designation: | Server | Power Provisioning: | Line-powered |
| Target Load | Actual Load | ssj_ops | |
|---|---|---|---|
| Target | Actual | ||
| Calibration 1 | 331,967 | ||
| Calibration 2 | 328,062 | ||
| Calibration 3 | 327,306 | ||
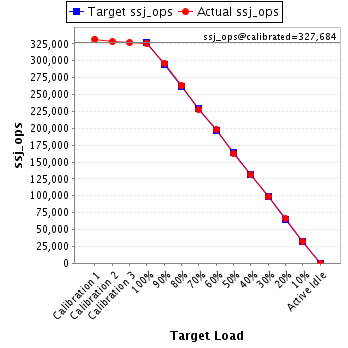
| ssj_ops@calibrated=327,684 | |||
| 100% | 99.6% | 327,684 | 326,264 |
| 90% | 90.3% | 294,916 | 296,024 |
| 80% | 80.2% | 262,147 | 262,814 |
| 70% | 69.5% | 229,379 | 227,848 |
| 60% | 60.4% | 196,610 | 197,773 |
| 50% | 49.8% | 163,842 | 163,230 |
| 40% | 40.0% | 131,074 | 131,146 |
| 30% | 30.1% | 98,305 | 98,503 |
| 20% | 20.1% | 65,537 | 65,861 |
| 10% | 9.9% | 32,768 | 32,459 |
| Active Idle | 0 | 0 | |
| Set Identifier: | sut |
| Set Description: | PRIMERGY TX300 S4 (Intel Xeon L5430) |
| # of Identical Nodes: | 1 |
| Comment: | None |
| Hardware | |
|---|---|
| Hardware Vendor: | Fujitsu Siemens Computers |
| Model: | PRIMERGY TX300 S4 (Intel Xeon L5430) |
| Form Factor: | -- |
| CPU Name: | Intel Xeon L5430 |
| CPU Characteristics: | 2.66GHz, 2x6MB L2 cache, 1333MHz system bus |
| CPU Frequency (MHz): | 2667 |
| CPU(s) Enabled: | 8 cores, 2 chips, 4 cores/chip |
| Hardware Threads: | 8 (1 / core) |
| CPU(s) Orderable: | 1,2 chips |
| Primary Cache: | 32 KB I + 32 KB D on chip per core |
| Secondary Cache: | 12 MB I+D on chip per chip, 6 MB shared / 2 cores |
| Tertiary Cache: | None |
| Other Cache: | None |
| Memory Amount (GB): | 8 |
| # and size of DIMM: | 4 x 2048 MB |
| Memory Details: | 8GB 2Rx8 PC2-5300F ECC CL5; slots 1A, 1B, 1C, 1D populated |
| Power Supply Quantity and Rating (W): | 1 x 700 |
| Power Supply Details: | HIPRO HP-W700WC3 |
| Disk Drive: | 1 x Seagate (3.5", SATA, 250GB, 7.2krpm) |
| Disk Controller: | LSI Logic Integrated SAS 3000 Series, 8-port with 1068E |
| # and type of Network Interface Cards (NICs) Installed: | 2 x Broadcom BCM5708C NetXtreme II GigE (onboard) |
| NICs Enabled in Firmware / OS / Connected: | 1/1/1 |
| Network Speed (Mbit): | 1000 |
| Keyboard: | KVM |
| Mouse: | KVM |
| Monitor: | KVM |
| Optical Drives: | No |
| Other Hardware: | None |
| Software | |
|---|---|
| Power Management: | Enabled ("Balanced" power scheme) |
| Operating System (OS): | Microsoft Windows Server 2008 Enterprise x64 Edition + SP2 |
| OS Version: | Version 6.0.6002 Service Pack 2, v.641 Build 6002 |
| Filesystem: | NTFS |
| JVM Vendor: | Oracle Corporation |
| JVM Version: | Oracle JRockit(R) 6 P28.0.0 (build P28.0.0-8-109238-1.6.0_05-20090130-1408-windows-x86_64) |
| JVM Command-line Options: | -Xms1700m -Xmx1700m -Xns1500m -XXaggressive -Xlargepages -Xgc:genpar -XXcallprofiling -XXgcthreads=2 -XXtlasize:min=4k,preferred=1024k -XXthroughputcompaction -XX:+UseStringCache |
| JVM Affinity: | start /affinity [0x03,0x30,0x0C,0xC0] |
| JVM Instances: | 8 |
| JVM Initial Heap (MB): | 1700 |
| JVM Maximum Heap (MB): | 1700 |
| JVM Address Bits: | 64 |
| Boot Firmware Version: | -- |
| Management Firmware Version: | -- |
| Workload Version: | SSJ 1.1.3 |
| Director Location: | Controller |
| Other Software: | None |
| JVM Instance | ssj_ops@100% |
|---|---|
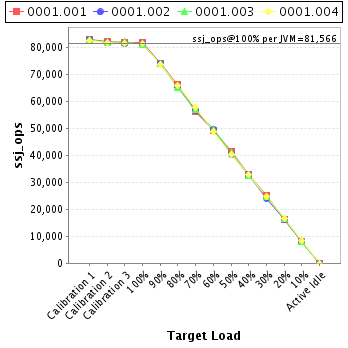
| 0001.001 | 81,890 |
| 0001.002 | 81,735 |
| 0001.003 | 81,049 |
| 0001.004 | 81,590 |
| ssj_ops@100% | 326,264 |
| ssj_ops@100% per JVM | 81,566 |
| Target Load | Actual Load | ssj_ops | |
|---|---|---|---|
| Target | Actual | ||
| Calibration 1 | 83,163 | ||
| Calibration 2 | 82,388 | ||
| Calibration 3 | 82,022 | ||
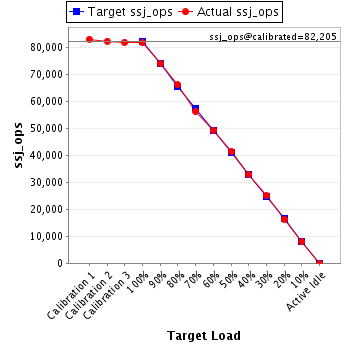
| ssj_ops@calibrated=82,205 | |||
| 100% | 99.6% | 82,205 | 81,890 |
| 90% | 90.1% | 73,985 | 74,100 |
| 80% | 80.5% | 65,764 | 66,171 |
| 70% | 68.5% | 57,544 | 56,325 |
| 60% | 60.1% | 49,323 | 49,435 |
| 50% | 50.4% | 41,103 | 41,416 |
| 40% | 40.1% | 32,882 | 32,938 |
| 30% | 30.4% | 24,662 | 25,007 |
| 20% | 19.9% | 16,441 | 16,375 |
| 10% | 9.7% | 8,221 | 7,941 |
| Active Idle | 0 | 0 | |
| Target Load | Actual Load | ssj_ops | |
|---|---|---|---|
| Target | Actual | ||
| Calibration 1 | 83,120 | ||
| Calibration 2 | 81,912 | ||
| Calibration 3 | 81,449 | ||
| ssj_ops@calibrated=81,680 | |||
| 100% | 100.1% | 81,680 | 81,735 |
| 90% | 90.7% | 73,512 | 74,059 |
| 80% | 80.3% | 65,344 | 65,605 |
| 70% | 69.4% | 57,176 | 56,703 |
| 60% | 60.9% | 49,008 | 49,774 |
| 50% | 49.6% | 40,840 | 40,538 |
| 40% | 40.1% | 32,672 | 32,783 |
| 30% | 29.5% | 24,504 | 24,106 |
| 20% | 19.8% | 16,336 | 16,175 |
| 10% | 9.9% | 8,168 | 8,114 |
| Active Idle | 0 | 0 | |

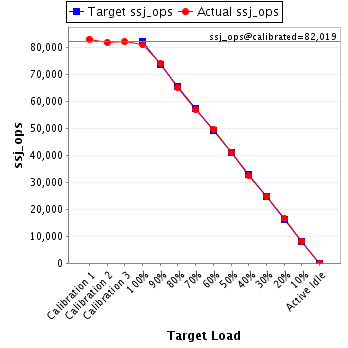
| Target Load | Actual Load | ssj_ops | |
|---|---|---|---|
| Target | Actual | ||
| Calibration 1 | 83,065 | ||
| Calibration 2 | 81,890 | ||
| Calibration 3 | 82,148 | ||
| ssj_ops@calibrated=82,019 | |||
| 100% | 98.8% | 82,019 | 81,049 |
| 90% | 90.3% | 73,817 | 74,055 |
| 80% | 79.4% | 65,615 | 65,112 |
| 70% | 69.5% | 57,413 | 56,970 |
| 60% | 60.7% | 49,211 | 49,763 |
| 50% | 50.0% | 41,010 | 41,015 |
| 40% | 39.7% | 32,808 | 32,581 |
| 30% | 30.1% | 24,606 | 24,649 |
| 20% | 20.2% | 16,404 | 16,537 |
| 10% | 9.9% | 8,202 | 8,137 |
| Active Idle | 0 | 0 | |
| Target Load | Actual Load | ssj_ops | |
|---|---|---|---|
| Target | Actual | ||
| Calibration 1 | 82,619 | ||
| Calibration 2 | 81,873 | ||
| Calibration 3 | 81,686 | ||
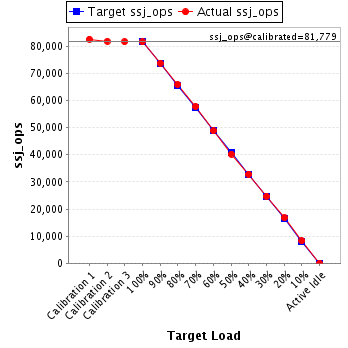
| ssj_ops@calibrated=81,779 | |||
| 100% | 99.8% | 81,779 | 81,590 |
| 90% | 90.3% | 73,602 | 73,810 |
| 80% | 80.6% | 65,424 | 65,927 |
| 70% | 70.7% | 57,246 | 57,849 |
| 60% | 59.7% | 49,068 | 48,800 |
| 50% | 49.2% | 40,890 | 40,262 |
| 40% | 40.2% | 32,712 | 32,844 |
| 30% | 30.3% | 24,534 | 24,741 |
| 20% | 20.5% | 16,356 | 16,775 |
| 10% | 10.1% | 8,178 | 8,267 |
| Active Idle | 0 | 0 | |