SPECpower_ssj2008
Host '0001' Performance Report
Copyright © 2007-2009 Standard Performance Evaluation Corporation
| Apple Inc. Xserve3,1 | ssj_ops@100% = 227,974 ssj_ops@100% per JVM = 56,994 |
||||
| Test Sponsor: | Apple Inc. | SPEC License #: | 77 | Test Method: | Single Node |
| Tested By: | Apple Inc. | Test Location: | Cupertino, CA, USA | Test Date: | Mar 16, 2009 |
| Hardware Availability: | Apr-2009 | Software Availability: | Apr-2009 | Publication: | Apr 8, 2009 |
| System Source: | Single Supplier | System Designation: | Server | Power Provisioning: | Line-powered |
| Target Load | Actual Load | ssj_ops | |
|---|---|---|---|
| Target | Actual | ||
| Calibration 1 | 228,520 | ||
| Calibration 2 | 228,302 | ||
| Calibration 3 | 229,992 | ||
| ssj_ops@calibrated=229,147 | |||
| 100% | 99.5% | 229,147 | 227,974 |
| 90% | 89.7% | 206,232 | 205,597 |
| 80% | 80.0% | 183,317 | 183,328 |
| 70% | 69.8% | 160,403 | 160,055 |
| 60% | 60.3% | 137,488 | 138,209 |
| 50% | 50.9% | 114,573 | 116,692 |
| 40% | 40.2% | 91,659 | 92,038 |
| 30% | 30.1% | 68,744 | 68,994 |
| 20% | 20.1% | 45,829 | 45,979 |
| 10% | 9.9% | 22,915 | 22,776 |
| Active Idle | 0 | 0 | |

| Set Identifier: | sut |
| Set Description: | Xserve3,1 |
| # of Identical Nodes: | 1 |
| Comment: | None |
| Hardware | |
|---|---|
| Hardware Vendor: | Apple Inc. |
| Model: | Xserve3,1 |
| Form Factor: | -- |
| CPU Name: | Intel(R) Xeon(R) CPU X5570 |
| CPU Characteristics: | Quad-Core, 2.93GHz, L3 8MB I+D on chip per chip |
| CPU Frequency (MHz): | 2930 |
| CPU(s) Enabled: | 8 cores, 2 chips, 4 cores/chip |
| Hardware Threads: | 16 (2 / core) |
| CPU(s) Orderable: | 1,2 chips |
| Primary Cache: | 32 KB I + 32 KB D on chip per core |
| Secondary Cache: | 256 KB I+D on chip per core |
| Tertiary Cache: | 8 MB I+D on chip per chip |
| Other Cache: | None |
| Memory Amount (GB): | 18 |
| # and size of DIMM: | 6 x 2 GB, 6 x 1 GB |
| Memory Details: | DDR3 ECC FB-DIMM, 1066 MHZ; 1GB in A1, A2, A3, B1, B2, B3; 2GB in A4, A5, A6, B4, B5, B6 |
| Power Supply Quantity and Rating (W): | 1 x 750 |
| Power Supply Details: | Apple Xserve 750W power supply |
| Disk Drive: | 1 X Western Digital WDC WD1602ABJS-43P5A0 160GB SATA drive |
| Disk Controller: | Integrated SAS controller |
| # and type of Network Interface Cards (NICs) Installed: | 2 x integrated 10/100/1000 NIC |
| NICs Enabled in Firmware / OS / Connected: | 2/1/1 |
| Network Speed (Mbit): | 1000 |
| Keyboard: | KVM |
| Mouse: | KVM |
| Monitor: | KVM |
| Optical Drives: | Yes |
| Other Hardware: | None |
| Software | |
|---|---|
| Power Management: | None |
| Operating System (OS): | Mac OS X Server |
| OS Version: | 10.5.6 (9G3550) |
| Filesystem: | Journaled HFS+ |
| JVM Vendor: | Sun Microsystems Inc. |
| JVM Version: | Java HotSpot(TM) 64-Bit Server VM on Mac OS X Server version 1.6.0_07-b06-153 |
| JVM Command-line Options: | -Djava.awt.headless=true -server -d64 -XX:+UseParallelGC -Xms2048m -Xmx2048m |
| JVM Affinity: | None |
| JVM Instances: | 8 |
| JVM Initial Heap (MB): | 2048 |
| JVM Maximum Heap (MB): | 2048 |
| JVM Address Bits: | 64 |
| Boot Firmware Version: | -- |
| Management Firmware Version: | -- |
| Workload Version: | SSJ 1.1.3 |
| Director Location: | SUT |
| Other Software: | None |
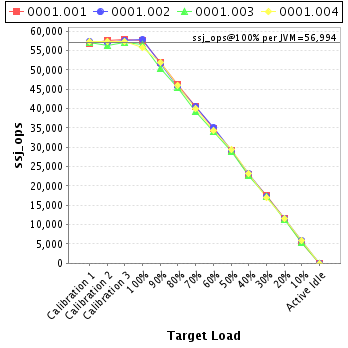
| JVM Instance | ssj_ops@100% |
|---|---|
| 0001.001 | 57,670 |
| 0001.002 | 57,809 |
| 0001.003 | 56,658 |
| 0001.004 | 55,837 |
| ssj_ops@100% | 227,974 |
| ssj_ops@100% per JVM | 56,994 |
| Target Load | Actual Load | ssj_ops | |
|---|---|---|---|
| Target | Actual | ||
| Calibration 1 | 56,840 | ||
| Calibration 2 | 57,591 | ||
| Calibration 3 | 57,922 | ||
| ssj_ops@calibrated=57,757 | |||
| 100% | 99.9% | 57,757 | 57,670 |
| 90% | 89.7% | 51,981 | 51,791 |
| 80% | 80.1% | 46,205 | 46,235 |
| 70% | 70.1% | 40,430 | 40,511 |
| 60% | 60.1% | 34,654 | 34,740 |
| 50% | 50.5% | 28,878 | 29,169 |
| 40% | 39.5% | 23,103 | 22,837 |
| 30% | 30.2% | 17,327 | 17,429 |
| 20% | 20.2% | 11,551 | 11,657 |
| 10% | 9.4% | 5,776 | 5,442 |
| Active Idle | 0 | 0 | |

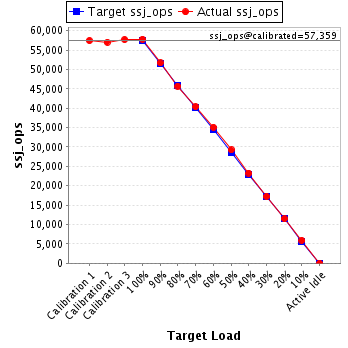
| Target Load | Actual Load | ssj_ops | |
|---|---|---|---|
| Target | Actual | ||
| Calibration 1 | 57,440 | ||
| Calibration 2 | 57,026 | ||
| Calibration 3 | 57,691 | ||
| ssj_ops@calibrated=57,359 | |||
| 100% | 100.8% | 57,359 | 57,809 |
| 90% | 90.1% | 51,623 | 51,675 |
| 80% | 79.6% | 45,887 | 45,685 |
| 70% | 70.4% | 40,151 | 40,391 |
| 60% | 61.2% | 34,415 | 35,094 |
| 50% | 51.0% | 28,679 | 29,258 |
| 40% | 40.6% | 22,943 | 23,279 |
| 30% | 30.1% | 17,208 | 17,284 |
| 20% | 20.0% | 11,472 | 11,467 |
| 10% | 10.3% | 5,736 | 5,929 |
| Active Idle | 0 | 0 | |
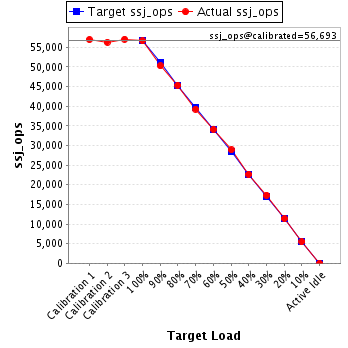
| Target Load | Actual Load | ssj_ops | |
|---|---|---|---|
| Target | Actual | ||
| Calibration 1 | 56,957 | ||
| Calibration 2 | 56,308 | ||
| Calibration 3 | 57,078 | ||
| ssj_ops@calibrated=56,693 | |||
| 100% | 99.9% | 56,693 | 56,658 |
| 90% | 88.7% | 51,024 | 50,287 |
| 80% | 80.0% | 45,354 | 45,347 |
| 70% | 69.3% | 39,685 | 39,270 |
| 60% | 60.2% | 34,016 | 34,130 |
| 50% | 51.0% | 28,347 | 28,916 |
| 40% | 40.0% | 22,677 | 22,681 |
| 30% | 30.6% | 17,008 | 17,340 |
| 20% | 20.0% | 11,339 | 11,358 |
| 10% | 9.7% | 5,669 | 5,476 |
| Active Idle | 0 | 0 | |
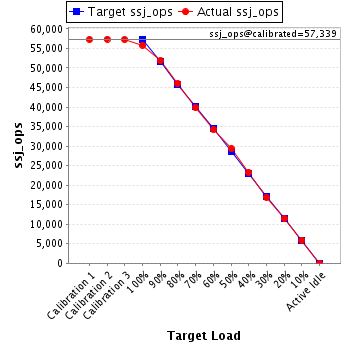
| Target Load | Actual Load | ssj_ops | |
|---|---|---|---|
| Target | Actual | ||
| Calibration 1 | 57,283 | ||
| Calibration 2 | 57,377 | ||
| Calibration 3 | 57,300 | ||
| ssj_ops@calibrated=57,339 | |||
| 100% | 97.4% | 57,339 | 55,837 |
| 90% | 90.4% | 51,605 | 51,844 |
| 80% | 80.3% | 45,871 | 46,062 |
| 70% | 69.6% | 40,137 | 39,883 |
| 60% | 59.7% | 34,403 | 34,245 |
| 50% | 51.2% | 28,669 | 29,349 |
| 40% | 40.5% | 22,935 | 23,241 |
| 30% | 29.5% | 17,202 | 16,941 |
| 20% | 20.1% | 11,468 | 11,497 |
| 10% | 10.3% | 5,734 | 5,929 |
| Active Idle | 0 | 0 | |