SPECpower_ssj2008
Host 'BL280G6-13' Performance Report
Copyright © 2007-2009 Standard Performance Evaluation Corporation
| Hewlett-Packard Company ProLiant BL280c G6 | ssj_ops@100% = 453,251 ssj_ops@100% per JVM = 113,313 |
||||
| Test Sponsor: | Hewlett-Packard Company | SPEC License #: | 3 | Test Method: | Multi Node |
| Tested By: | Hewlett-Packard Company | Test Location: | Houston, TX, USA | Test Date: | Jun 25, 2009 |
| Hardware Availability: | Aug-2009 | Software Availability: | Aug-2009 | Publication: | Jul 15, 2009 |
| System Source: | Single Supplier | System Designation: | Server | Power Provisioning: | Line-powered |
| Target Load | Actual Load | ssj_ops | |
|---|---|---|---|
| Target | Actual | ||
| Calibration 1 | 446,934 | ||
| Calibration 2 | 453,224 | ||
| Calibration 3 | 454,203 | ||
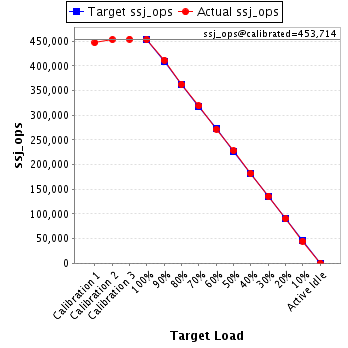
| ssj_ops@calibrated=453,714 | |||
| 100% | 99.9% | 453,714 | 453,251 |
| 90% | 90.7% | 408,342 | 411,621 |
| 80% | 80.0% | 362,971 | 362,831 |
| 70% | 70.3% | 317,600 | 318,864 |
| 60% | 59.9% | 272,228 | 271,874 |
| 50% | 50.2% | 226,857 | 227,959 |
| 40% | 40.1% | 181,485 | 181,861 |
| 30% | 30.0% | 136,114 | 135,992 |
| 20% | 19.9% | 90,743 | 90,201 |
| 10% | 9.9% | 45,371 | 44,790 |
| Active Idle | 0 | 0 | |
| Set Identifier: | sut |
| Set Description: | System Under Test |
| # of Identical Nodes: | 16 |
| Comment: | None |
| Hardware | |
|---|---|
| Hardware Vendor: | Hewlett-Packard Company |
| Model: | ProLiant BL280c G6 |
| Form Factor: | Blade |
| CPU Name: | Intel Xeon L5520 |
| CPU Characteristics: | 2.27GHz, 8 MB L3, 1333 MHz system bus |
| CPU Frequency (MHz): | 2267 |
| CPU(s) Enabled: | 8 cores, 2 chips, 4 cores/chip |
| Hardware Threads: | 16 (2 / core) |
| CPU(s) Orderable: | 1,2 chips |
| Primary Cache: | 32 KB I + 32 KB D on chip per core |
| Secondary Cache: | 256 KB I+D on chip per core |
| Tertiary Cache: | 8 MB I+D on chip per chip |
| Other Cache: | None |
| Memory Amount (GB): | 8.0 |
| # and size of DIMM: | 4 x 2048 MB |
| Memory Details: | PC3-10600E; Slots 2A and 4B populated on each CPU node |
| Power Supply Quantity and Rating (W): | None |
| Power Supply Details: | Shared |
| Disk Drive: | 1 x 32 GB SSD 2.5" SATA; HP part #461201-B21 |
| Disk Controller: | Integrated SATA controller |
| # and type of Network Interface Cards (NICs) Installed: | 2 x NC362i |
| NICs Enabled in Firmware / OS / Connected: | 2/2/1 |
| Network Speed (Mbit): | 1000 |
| Keyboard: | None |
| Mouse: | None |
| Monitor: | None |
| Optical Drives: | No |
| Other Hardware: | None |
| Software | |
|---|---|
| Power Management: | Enabled (see SUT Notes) |
| Operating System (OS): | Microsoft Windows Server 2008 x64 Enterprise Edition |
| OS Version: | Service Pack 2 |
| Filesystem: | NTFS |
| JVM Vendor: | Oracle Corporation |
| JVM Version: | Oracle JRockit(R) (build P28.0.0-29-114096-1.6.0_11-20090427-1759-windows-x86_64, compiled mode) |
| JVM Command-line Options: | -Xms1650m -Xmx1650m -Xns1500m -XXaggressive -XlargePages -XXthroughputCompaction -XXcallprofiling -XXlazyUnlocking -Xgc:genpar -XXgcthreads:4 -XXtlasize:min=12k,preferred=1024k |
| JVM Affinity: | start /affinity [F,F0,F00,F000] |
| JVM Instances: | 4 |
| JVM Initial Heap (MB): | 1650 |
| JVM Maximum Heap (MB): | 1650 |
| JVM Address Bits: | 64 |
| Boot Firmware Version: | I22 06/01/2009 |
| Management Firmware Version: | 1.77 03/30/2009 |
| Workload Version: | SSJ 1.2.6 |
| Director Location: | Controller |
| Other Software: | None |
| JVM Instance | ssj_ops@100% |
|---|---|
| BL280G6-13.001 | 113,813 |
| BL280G6-13.002 | 113,299 |
| BL280G6-13.003 | 113,259 |
| BL280G6-13.004 | 112,881 |
| ssj_ops@100% | 453,251 |
| ssj_ops@100% per JVM | 113,313 |

| Target Load | Actual Load | ssj_ops | |
|---|---|---|---|
| Target | Actual | ||
| Calibration 1 | 111,191 | ||
| Calibration 2 | 113,492 | ||
| Calibration 3 | 113,201 | ||
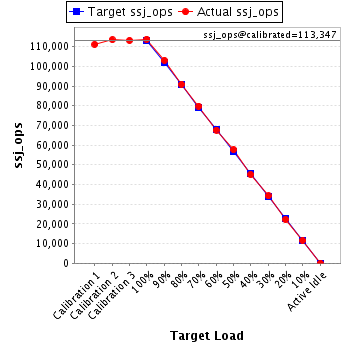
| ssj_ops@calibrated=113,347 | |||
| 100% | 100.4% | 113,347 | 113,813 |
| 90% | 90.9% | 102,012 | 103,051 |
| 80% | 80.2% | 90,677 | 90,920 |
| 70% | 70.4% | 79,343 | 79,824 |
| 60% | 59.7% | 68,008 | 67,670 |
| 50% | 50.8% | 56,673 | 57,634 |
| 40% | 39.7% | 45,339 | 45,003 |
| 30% | 30.2% | 34,004 | 34,182 |
| 20% | 19.6% | 22,669 | 22,208 |
| 10% | 10.3% | 11,335 | 11,637 |
| Active Idle | 0 | 0 | |
| Target Load | Actual Load | ssj_ops | |
|---|---|---|---|
| Target | Actual | ||
| Calibration 1 | 111,470 | ||
| Calibration 2 | 113,757 | ||
| Calibration 3 | 114,209 | ||
| ssj_ops@calibrated=113,983 | |||
| 100% | 99.4% | 113,983 | 113,299 |
| 90% | 90.9% | 102,585 | 103,556 |
| 80% | 80.4% | 91,186 | 91,695 |
| 70% | 70.1% | 79,788 | 79,955 |
| 60% | 60.7% | 68,390 | 69,199 |
| 50% | 49.6% | 56,992 | 56,577 |
| 40% | 40.5% | 45,593 | 46,115 |
| 30% | 30.3% | 34,195 | 34,488 |
| 20% | 19.9% | 22,797 | 22,699 |
| 10% | 9.8% | 11,398 | 11,116 |
| Active Idle | 0 | 0 | |

| Target Load | Actual Load | ssj_ops | |
|---|---|---|---|
| Target | Actual | ||
| Calibration 1 | 112,703 | ||
| Calibration 2 | 113,496 | ||
| Calibration 3 | 114,018 | ||
| ssj_ops@calibrated=113,757 | |||
| 100% | 99.6% | 113,757 | 113,259 |
| 90% | 91.1% | 102,381 | 103,608 |
| 80% | 80.1% | 91,005 | 91,068 |
| 70% | 70.5% | 79,630 | 80,211 |
| 60% | 59.1% | 68,254 | 67,251 |
| 50% | 50.4% | 56,878 | 57,306 |
| 40% | 40.0% | 45,503 | 45,518 |
| 30% | 30.2% | 34,127 | 34,354 |
| 20% | 19.9% | 22,751 | 22,635 |
| 10% | 9.6% | 11,376 | 10,937 |
| Active Idle | 0 | 0 | |

| Target Load | Actual Load | ssj_ops | |
|---|---|---|---|
| Target | Actual | ||
| Calibration 1 | 111,571 | ||
| Calibration 2 | 112,479 | ||
| Calibration 3 | 112,775 | ||
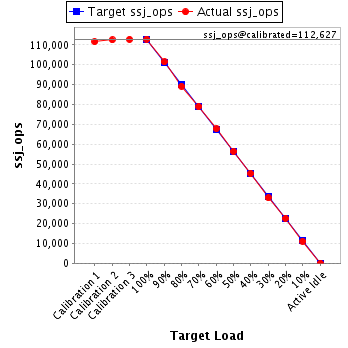
| ssj_ops@calibrated=112,627 | |||
| 100% | 100.2% | 112,627 | 112,881 |
| 90% | 90.0% | 101,364 | 101,406 |
| 80% | 79.2% | 90,102 | 89,148 |
| 70% | 70.0% | 78,839 | 78,875 |
| 60% | 60.2% | 67,576 | 67,753 |
| 50% | 50.1% | 56,314 | 56,442 |
| 40% | 40.2% | 45,051 | 45,225 |
| 30% | 29.3% | 33,788 | 32,967 |
| 20% | 20.1% | 22,525 | 22,658 |
| 10% | 9.9% | 11,263 | 11,099 |
| Active Idle | 0 | 0 | |