SPECpower_ssj2008
Host 'node2' Performance Report
Copyright © 2007-2009 Standard Performance Evaluation Corporation
| Hewlett-Packard Company ProLiant SL2x170z G6 (2.4 GHz, Intel Xeon L5530) | ssj_ops@100% = 526,118 ssj_ops@100% per JVM = 131,529 |
||||
| Test Sponsor: | Hewlett-Packard Company | SPEC License #: | 3 | Test Method: | Multi Node |
| Tested By: | Hewlett-Packard Company | Test Location: | Houston, TX, USA | Test Date: | Sep 3, 2009 |
| Hardware Availability: | Oct-2009 | Software Availability: | Jul-2009 | Publication: | Nov 4, 2009 |
| System Source: | Single Supplier | System Designation: | Server | Power Provisioning: | Line-powered |
| Target Load | Actual Load | ssj_ops | |
|---|---|---|---|
| Target | Actual | ||
| Calibration 1 | 524,703 | ||
| Calibration 2 | 528,837 | ||
| Calibration 3 | 528,183 | ||
| ssj_ops@calibrated=528,510 | |||
| 100% | 99.5% | 528,510 | 526,118 |
| 90% | 90.2% | 475,659 | 476,857 |
| 80% | 80.0% | 422,808 | 422,923 |
| 70% | 69.5% | 369,957 | 367,233 |
| 60% | 59.5% | 317,106 | 314,653 |
| 50% | 50.0% | 264,255 | 264,264 |
| 40% | 40.0% | 211,404 | 211,473 |
| 30% | 30.1% | 158,553 | 159,308 |
| 20% | 20.1% | 105,702 | 106,148 |
| 10% | 9.9% | 52,851 | 52,080 |
| Active Idle | 0 | 0 | |

| Set Identifier: | sut |
| Set Description: | ProLiant SL2x170z G6 |
| # of Identical Nodes: | 4 |
| Comment: | None |
| Hardware | |
|---|---|
| Hardware Vendor: | Hewlett-Packard Company |
| Model: | ProLiant SL2x170z G6 (2.4 GHz, Intel Xeon L5530) |
| Form Factor: | 2U |
| CPU Name: | Intel Xeon L5530 |
| CPU Characteristics: | Quad-Core, 2.40 GHz, 8 MB L3 cache |
| CPU Frequency (MHz): | 2400 |
| CPU(s) Enabled: | 8 cores, 2 chips, 4 cores/chip |
| Hardware Threads: | 16 (2 / core) |
| CPU(s) Orderable: | 1,2 chips |
| Primary Cache: | 32 KB I + 32 KB D on chip per core |
| Secondary Cache: | 256 KB I+D on chip per core |
| Tertiary Cache: | 8 MB I+D on chip per chip |
| Other Cache: | None |
| Memory Amount (GB): | 8 |
| # and size of DIMM: | 4 x 2048 MB |
| Memory Details: | 2GB 2Rx8 PC3-10600E; slots 1 and 4 are populated on each processor |
| Power Supply Quantity and Rating (W): | None |
| Power Supply Details: | Shared |
| Disk Drive: | 1 x 60GB SSD 2.5" SATA, HP part #:586585-B21 |
| Disk Controller: | Integrated SATA |
| # and type of Network Interface Cards (NICs) Installed: | 2 x HP NC362i Dual Port Multifunction Gigabit Server Adapters |
| NICs Enabled in Firmware / OS / Connected: | 2/2/1 |
| Network Speed (Mbit): | 1000 |
| Keyboard: | None |
| Mouse: | None |
| Monitor: | None |
| Optical Drives: | No |
| Other Hardware: | None |
| Software | |
|---|---|
| Power Management: | Power saver plan in OS |
| Operating System (OS): | Windows Server 2008 x64, Enterprise Edition |
| OS Version: | SP2 |
| Filesystem: | NTFS |
| JVM Vendor: | IBM Corporation |
| JVM Version: | IBM J9 VM (build 2.4, J2RE 1.6.0 IBM J9 2.4 Windows Server 2008 amd64-64 jvmwa6460sr5-20090519_35743 (JIT enabled, AOT enabled) |
| JVM Command-line Options: | -Xaggressive -Xcompressedrefs -Xgcpolicy:gencon -Xmn1100m -Xms1600m -Xmx1600m -XlockReservation -Xnoloa -XtlhPrefetch -Xlp -Xgcthreads4 |
| JVM Affinity: | start /affinity [0xF, 0xF0, 0xF00, 0xF000] |
| JVM Instances: | 4 |
| JVM Initial Heap (MB): | 1600 |
| JVM Maximum Heap (MB): | 1600 |
| JVM Address Bits: | 64 |
| Boot Firmware Version: | O34 8/25/09 |
| Management Firmware Version: | 4.04 7/1/09 |
| Workload Version: | SSJ 1.2.6 |
| Director Location: | Controller |
| Other Software: | NIC driver, HP component cp010296.exe. Driver version: 10.3.49.400 |
| JVM Instance | ssj_ops@100% |
|---|---|
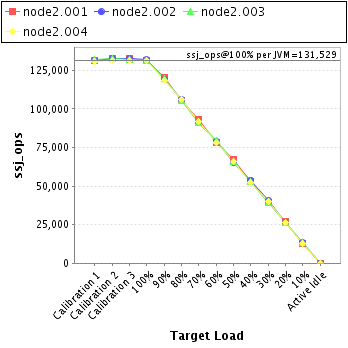
| node2.001 | 131,558 |
| node2.002 | 131,710 |
| node2.003 | 131,496 |
| node2.004 | 131,354 |
| ssj_ops@100% | 526,118 |
| ssj_ops@100% per JVM | 131,529 |
| Target Load | Actual Load | ssj_ops | |
|---|---|---|---|
| Target | Actual | ||
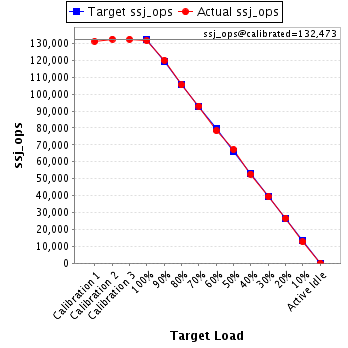
| Calibration 1 | 131,203 | ||
| Calibration 2 | 132,493 | ||
| Calibration 3 | 132,453 | ||
| ssj_ops@calibrated=132,473 | |||
| 100% | 99.3% | 132,473 | 131,558 |
| 90% | 90.6% | 119,226 | 120,015 |
| 80% | 79.6% | 105,979 | 105,416 |
| 70% | 70.2% | 92,731 | 92,977 |
| 60% | 59.1% | 79,484 | 78,324 |
| 50% | 50.8% | 66,237 | 67,289 |
| 40% | 39.8% | 52,989 | 52,726 |
| 30% | 29.8% | 39,742 | 39,416 |
| 20% | 20.2% | 26,495 | 26,720 |
| 10% | 9.6% | 13,247 | 12,732 |
| Active Idle | 0 | 0 | |
| Target Load | Actual Load | ssj_ops | |
|---|---|---|---|
| Target | Actual | ||
| Calibration 1 | 131,452 | ||
| Calibration 2 | 132,804 | ||
| Calibration 3 | 132,433 | ||
| ssj_ops@calibrated=132,619 | |||
| 100% | 99.3% | 132,619 | 131,710 |
| 90% | 89.7% | 119,357 | 119,004 |
| 80% | 79.8% | 106,095 | 105,815 |
| 70% | 68.9% | 92,833 | 91,437 |
| 60% | 59.6% | 79,571 | 78,998 |
| 50% | 49.1% | 66,309 | 65,142 |
| 40% | 40.6% | 53,047 | 53,886 |
| 30% | 30.4% | 39,786 | 40,365 |
| 20% | 20.1% | 26,524 | 26,662 |
| 10% | 10.0% | 13,262 | 13,245 |
| Active Idle | 0 | 0 | |

| Target Load | Actual Load | ssj_ops | |
|---|---|---|---|
| Target | Actual | ||
| Calibration 1 | 131,646 | ||
| Calibration 2 | 132,531 | ||
| Calibration 3 | 132,139 | ||
| ssj_ops@calibrated=132,335 | |||
| 100% | 99.4% | 132,335 | 131,496 |
| 90% | 90.4% | 119,102 | 119,621 |
| 80% | 79.8% | 105,868 | 105,642 |
| 70% | 69.0% | 92,635 | 91,246 |
| 60% | 60.0% | 79,401 | 79,430 |
| 50% | 49.8% | 66,168 | 65,907 |
| 40% | 39.8% | 52,934 | 52,623 |
| 30% | 29.8% | 39,701 | 39,450 |
| 20% | 20.1% | 26,467 | 26,645 |
| 10% | 10.0% | 13,234 | 13,296 |
| Active Idle | 0 | 0 | |

| Target Load | Actual Load | ssj_ops | |
|---|---|---|---|
| Target | Actual | ||
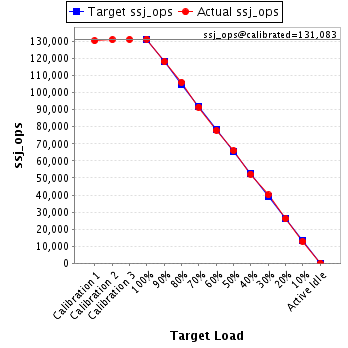
| Calibration 1 | 130,402 | ||
| Calibration 2 | 131,008 | ||
| Calibration 3 | 131,158 | ||
| ssj_ops@calibrated=131,083 | |||
| 100% | 100.2% | 131,083 | 131,354 |
| 90% | 90.2% | 117,975 | 118,216 |
| 80% | 80.9% | 104,866 | 106,050 |
| 70% | 69.9% | 91,758 | 91,573 |
| 60% | 59.4% | 78,650 | 77,901 |
| 50% | 50.3% | 65,541 | 65,927 |
| 40% | 39.9% | 52,433 | 52,239 |
| 30% | 30.6% | 39,325 | 40,078 |
| 20% | 19.9% | 26,217 | 26,120 |
| 10% | 9.8% | 13,108 | 12,808 |
| Active Idle | 0 | 0 | |