SPECpower_ssj2008
Host 'WIN-W9VDLALRRFR' Performance Report
Copyright © 2007-2010 Standard Performance Evaluation Corporation
| Fujitsu PRIMERGY RX100 S6 (Intel Xeon X3470) | ssj_ops@100% = 278,441 ssj_ops@100% per JVM = 139,220 |
||||
| Test Sponsor: | Fujitsu | SPEC License #: | 19 | Test Method: | Single Node |
| Tested By: | Fujitsu | Test Location: | Paderborn, NRW, Germany | Test Date: | Jan 6, 2010 |
| Hardware Availability: | Jan-2010 | Software Availability: | May-2009 | Publication: | Feb 2, 2010 |
| System Source: | Single Supplier | System Designation: | Server | Power Provisioning: | Line-powered |
| Target Load | Actual Load | ssj_ops | |
|---|---|---|---|
| Target | Actual | ||
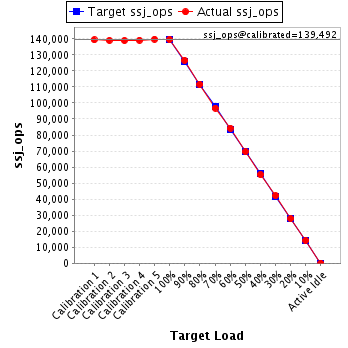
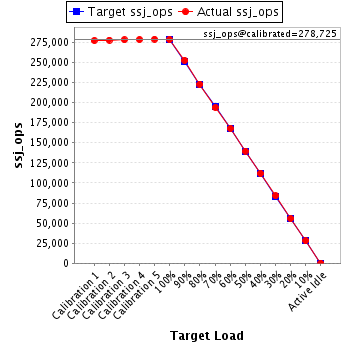
| Calibration 1 | 277,325 | ||
| Calibration 2 | 277,958 | ||
| Calibration 3 | 278,166 | ||
| Calibration 4 | 278,427 | ||
| Calibration 5 | 279,023 | ||
| ssj_ops@calibrated=278,725 | |||
| 100% | 99.9% | 278,725 | 278,441 |
| 90% | 90.7% | 250,853 | 252,747 |
| 80% | 80.0% | 222,980 | 223,063 |
| 70% | 69.6% | 195,108 | 193,931 |
| 60% | 60.2% | 167,235 | 167,911 |
| 50% | 50.1% | 139,363 | 139,758 |
| 40% | 40.2% | 111,490 | 111,916 |
| 30% | 30.1% | 83,618 | 83,882 |
| 20% | 20.0% | 55,745 | 55,771 |
| 10% | 10.1% | 27,873 | 28,045 |
| Active Idle | 0 | 0 | |
| Set Identifier: | SUT |
| Set Description: | System Under Test |
| # of Identical Nodes: | 1 |
| Comment: | None |
| Hardware | |
|---|---|
| Hardware Vendor: | Fujitsu |
| Model: | PRIMERGY RX100 S6 (Intel Xeon X3470) |
| Form Factor: | 1U |
| CPU Name: | Intel Xeon X3470 |
| CPU Characteristics: | Quad-Core, 2.93GHz, 8MB L3 Cache |
| CPU Frequency (MHz): | 2933 |
| CPU(s) Enabled: | 4 cores, 1 chip, 4 cores/chip |
| Hardware Threads: | 8 (2 / core) |
| CPU(s) Orderable: | 1 chip |
| Primary Cache: | 32 KB I + 32 KB D on chip per core |
| Secondary Cache: | 256 KB I+D on chip per core |
| Tertiary Cache: | 8 MB I+D on chip per chip |
| Other Cache: | None |
| Memory Amount (GB): | 4 |
| # and size of DIMM: | 2 x 2048 MB |
| Memory Details: | 2GB 2Rx8 PC3-10600E ECC CL9; slots 1A, 1B populated |
| Power Supply Quantity and Rating (W): | 1 x 350 |
| Power Supply Details: | Fujitsu Technology Solutions DPS-350YB A |
| Disk Drive: | 1 x 160GB HDD SATA (2.5",5.4krpm) |
| Disk Controller: | Integrated SATA Controller |
| # and type of Network Interface Cards (NICs) Installed: | 1 x Intel 82578DM and 1 x Intel 82574L Gigabit Network Connection (onboard) |
| NICs Enabled in Firmware / OS / Connected: | 1/1/1 |
| Network Speed (Mbit): | 1000 |
| Keyboard: | None |
| Mouse: | None |
| Monitor: | None |
| Optical Drives: | No |
| Other Hardware: | None |
| Software | |
|---|---|
| Power Management: | Enabled ("Fujitsu Enhanced Power Settings" power plan) |
| Operating System (OS): | Microsoft Windows Server 2008 Enterprise x64 Edition + SP2 |
| OS Version: | Version 6.0.6002 Service Pack 2 Build 6002 |
| Filesystem: | NTFS |
| JVM Vendor: | Oracle Corporation |
| JVM Version: | Oracle JRockit(R) 6 P28.0.0 (build P28.0.0-29-114096-1.6.0_11-20090427-1759-windows-x86_64) |
| JVM Command-line Options: | -Xms1625m -Xmx1625m -Xns1400m -XXaggressive -Xlargepages -Xgc:genpar -XXcallprofiling -XXgcthreads=4 -XXtlasize:min=4k,preferred=1024k |
| JVM Affinity: | start /affinity [0x0F,0xF0] |
| JVM Instances: | 2 |
| JVM Initial Heap (MB): | 1625 |
| JVM Maximum Heap (MB): | 1625 |
| JVM Address Bits: | 64 |
| Boot Firmware Version: | 1.05 |
| Management Firmware Version: | 3.88A |
| Workload Version: | SSJ 1.2.6 |
| Director Location: | Controller |
| Other Software: | None |
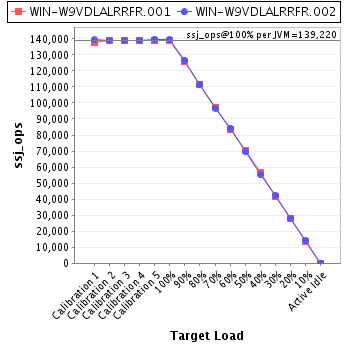
| JVM Instance | ssj_ops@100% |
|---|---|
| WIN-W9VDLALRRFR.001 | 138,944 |
| WIN-W9VDLALRRFR.002 | 139,497 |
| ssj_ops@100% | 278,441 |
| ssj_ops@100% per JVM | 139,220 |
| Target Load | Actual Load | ssj_ops | |
|---|---|---|---|
| Target | Actual | ||
| Calibration 1 | 137,974 | ||
| Calibration 2 | 138,905 | ||
| Calibration 3 | 139,210 | ||
| Calibration 4 | 139,226 | ||
| Calibration 5 | 139,239 | ||
| ssj_ops@calibrated=139,233 | |||
| 100% | 99.8% | 139,233 | 138,944 |
| 90% | 90.6% | 125,310 | 126,110 |
| 80% | 80.0% | 111,386 | 111,399 |
| 70% | 69.7% | 97,463 | 97,110 |
| 60% | 60.1% | 83,540 | 83,635 |
| 50% | 50.4% | 69,616 | 70,237 |
| 40% | 40.7% | 55,693 | 56,680 |
| 30% | 30.0% | 41,770 | 41,781 |
| 20% | 20.1% | 27,847 | 27,928 |
| 10% | 9.9% | 13,923 | 13,806 |
| Active Idle | 0 | 0 | |
| Target Load | Actual Load | ssj_ops | |
|---|---|---|---|
| Target | Actual | ||
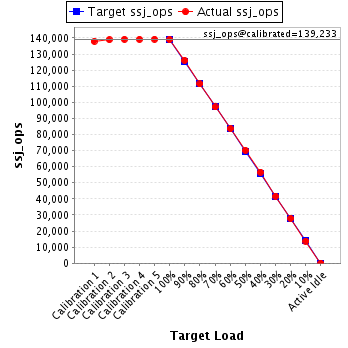
| Calibration 1 | 139,351 | ||
| Calibration 2 | 139,052 | ||
| Calibration 3 | 138,956 | ||
| Calibration 4 | 139,201 | ||
| Calibration 5 | 139,784 | ||
| ssj_ops@calibrated=139,492 | |||
| 100% | 100.0% | 139,492 | 139,497 |
| 90% | 90.8% | 125,543 | 126,637 |
| 80% | 80.1% | 111,594 | 111,664 |
| 70% | 69.4% | 97,645 | 96,821 |
| 60% | 60.4% | 83,695 | 84,276 |
| 50% | 49.8% | 69,746 | 69,520 |
| 40% | 39.6% | 55,797 | 55,235 |
| 30% | 30.2% | 41,848 | 42,101 |
| 20% | 20.0% | 27,898 | 27,843 |
| 10% | 10.2% | 13,949 | 14,239 |
| Active Idle | 0 | 0 | |