SPECpower_ssj2008
Host 'Node-16' Performance Report
Copyright © 2007-2010 Standard Performance Evaluation Corporation
| Fujitsu PRIMERGY CX120 S1 (Intel Xeon L5530) | ssj_ops@100% = 529,473 ssj_ops@100% per JVM = 132,368 |
||||
| Test Sponsor: | Fujitsu | SPEC License #: | 19 | Test Method: | Multi Node |
| Tested By: | Fujitsu | Test Location: | Paderborn, NRW, Germany | Test Date: | Mar 7, 2010 |
| Hardware Availability: | Jun-2010 | Software Availability: | Nov-2009 | Publication: | Mar 24, 2010 |
| System Source: | Single Supplier | System Designation: | Server | Power Provisioning: | Line-powered |
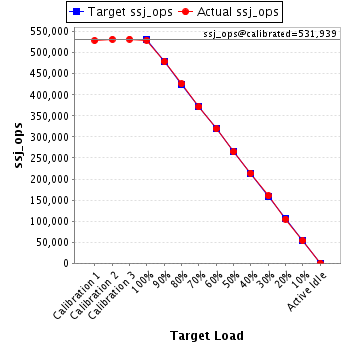
| Target Load | Actual Load | ssj_ops | |
|---|---|---|---|
| Target | Actual | ||
| Calibration 1 | 529,105 | ||
| Calibration 2 | 531,705 | ||
| Calibration 3 | 532,173 | ||
| ssj_ops@calibrated=531,939 | |||
| 100% | 99.5% | 531,939 | 529,473 |
| 90% | 90.0% | 478,745 | 478,946 |
| 80% | 80.1% | 425,551 | 426,017 |
| 70% | 69.8% | 372,357 | 371,462 |
| 60% | 60.0% | 319,163 | 319,329 |
| 50% | 49.7% | 265,969 | 264,430 |
| 40% | 40.2% | 212,776 | 213,677 |
| 30% | 30.1% | 159,582 | 160,156 |
| 20% | 19.7% | 106,388 | 105,004 |
| 10% | 10.1% | 53,194 | 53,730 |
| Active Idle | 0 | 0 | |
| Set Identifier: | SUT |
| Set Description: | Set of 38 identically configured PRIMERGY CX120 S1 servers |
| # of Identical Nodes: | 38 |
| Comment: | None |
| Hardware | |
|---|---|
| Hardware Vendor: | Fujitsu |
| Model: | PRIMERGY CX120 S1 (Intel Xeon L5530) |
| Form Factor: | 1U |
| CPU Name: | Intel Xeon L5530 |
| CPU Characteristics: | Quad-Core, 2.40GHz, 8MB L3 Cache |
| CPU Frequency (MHz): | 2400 |
| CPU(s) Enabled: | 8 cores, 2 chips, 4 cores/chip |
| Hardware Threads: | 16 (2 / core) |
| CPU(s) Orderable: | 1,2 chips |
| Primary Cache: | 32 KB I + 32 KB D on chip per core |
| Secondary Cache: | 256 KB I+D on chip per core |
| Tertiary Cache: | 8 MB I+D on chip per chip |
| Other Cache: | None |
| Memory Amount (GB): | 8 |
| # and size of DIMM: | 4 x 2048 MB |
| Memory Details: | 2GB 2Rx8 PC3-10600E ECC CL9; slots B1, C1, E1, F1 populated |
| Power Supply Quantity and Rating (W): | 1 x 400 |
| Power Supply Details: | Fujitsu Technology Solutions DPS-460GP A |
| Disk Drive: | 1 x 160GB HDD SATA (2.5", 5.4krpm) |
| Disk Controller: | Integrated SATA Controller |
| # and type of Network Interface Cards (NICs) Installed: | 2 x Intel 82576 Gigabit Network Connection (onboard) |
| NICs Enabled in Firmware / OS / Connected: | 2/1/1 |
| Network Speed (Mbit): | 1000 |
| Keyboard: | None |
| Mouse: | None |
| Monitor: | None |
| Optical Drives: | No |
| Other Hardware: | None |
| Software | |
|---|---|
| Power Management: | Enabled ("Fujitsu Enhanced Power Settings" power plan) |
| Operating System (OS): | Microsoft Windows Server 2008 R2 Enterprise |
| OS Version: | Version 6.1.7600 Build 7600 |
| Filesystem: | NTFS |
| JVM Vendor: | IBM Corporation |
| JVM Version: | IBM J9 VM (build 2.4, JRE 1.6.0 IBM J9 2.4 Windows Server 2008 amd64-64 jvmwa6460sr6-20090923_42924 (JIT enabled, AOT enabled) |
| JVM Command-line Options: | -Xaggressive -Xcompressedrefs -Xgcpolicy:gencon -Xmn1400m -Xms1550m -Xmx1550m -XlockReservation -Xnoloa -XtlhPrefetch -Xlp -Xgcthreads4 |
| JVM Affinity: | start /affinity [0x000F,0x00F0,0x0F00,0xF000] |
| JVM Instances: | 4 |
| JVM Initial Heap (MB): | 1550 |
| JVM Maximum Heap (MB): | 1550 |
| JVM Address Bits: | 64 |
| Boot Firmware Version: | 0.46 |
| Management Firmware Version: | 0.48 |
| Workload Version: | SSJ 1.2.6 |
| Director Location: | Controller |
| Other Software: | None |
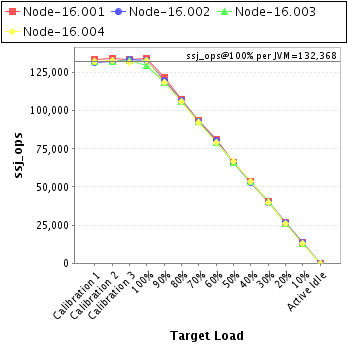
| JVM Instance | ssj_ops@100% |
|---|---|
| Node-16.001 | 134,042 |
| Node-16.002 | 133,003 |
| Node-16.003 | 129,483 |
| Node-16.004 | 132,946 |
| ssj_ops@100% | 529,473 |
| ssj_ops@100% per JVM | 132,368 |
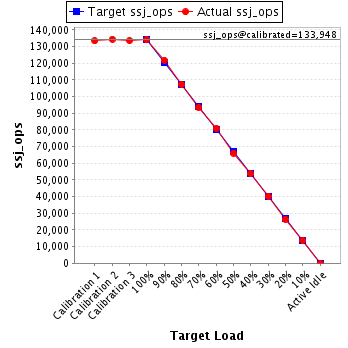
| Target Load | Actual Load | ssj_ops | |
|---|---|---|---|
| Target | Actual | ||
| Calibration 1 | 133,332 | ||
| Calibration 2 | 134,412 | ||
| Calibration 3 | 133,484 | ||
| ssj_ops@calibrated=133,948 | |||
| 100% | 100.1% | 133,948 | 134,042 |
| 90% | 91.0% | 120,553 | 121,835 |
| 80% | 80.2% | 107,159 | 107,465 |
| 70% | 69.9% | 93,764 | 93,575 |
| 60% | 60.4% | 80,369 | 80,885 |
| 50% | 49.3% | 66,974 | 66,036 |
| 40% | 40.1% | 53,579 | 53,728 |
| 30% | 30.1% | 40,184 | 40,328 |
| 20% | 19.8% | 26,790 | 26,474 |
| 10% | 10.3% | 13,395 | 13,816 |
| Active Idle | 0 | 0 | |
| Target Load | Actual Load | ssj_ops | |
|---|---|---|---|
| Target | Actual | ||
| Calibration 1 | 131,580 | ||
| Calibration 2 | 132,379 | ||
| Calibration 3 | 133,680 | ||
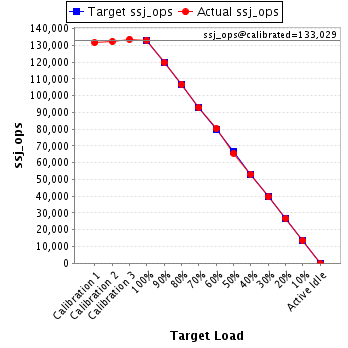
| ssj_ops@calibrated=133,029 | |||
| 100% | 100.0% | 133,029 | 133,003 |
| 90% | 90.0% | 119,726 | 119,758 |
| 80% | 80.2% | 106,423 | 106,702 |
| 70% | 69.8% | 93,120 | 92,840 |
| 60% | 60.4% | 79,817 | 80,286 |
| 50% | 49.4% | 66,515 | 65,720 |
| 40% | 39.9% | 53,212 | 53,080 |
| 30% | 29.8% | 39,909 | 39,600 |
| 20% | 20.0% | 26,606 | 26,649 |
| 10% | 10.2% | 13,303 | 13,550 |
| Active Idle | 0 | 0 | |
| Target Load | Actual Load | ssj_ops | |
|---|---|---|---|
| Target | Actual | ||
| Calibration 1 | 132,208 | ||
| Calibration 2 | 132,205 | ||
| Calibration 3 | 133,109 | ||
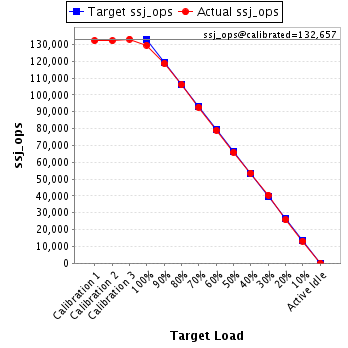
| ssj_ops@calibrated=132,657 | |||
| 100% | 97.6% | 132,657 | 129,483 |
| 90% | 89.4% | 119,391 | 118,617 |
| 80% | 79.9% | 106,126 | 105,982 |
| 70% | 69.9% | 92,860 | 92,674 |
| 60% | 59.5% | 79,594 | 78,962 |
| 50% | 49.7% | 66,329 | 65,870 |
| 40% | 40.3% | 53,063 | 53,520 |
| 30% | 30.5% | 39,797 | 40,478 |
| 20% | 19.5% | 26,531 | 25,807 |
| 10% | 9.9% | 13,266 | 13,195 |
| Active Idle | 0 | 0 | |
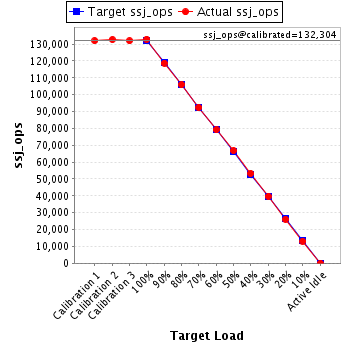
| Target Load | Actual Load | ssj_ops | |
|---|---|---|---|
| Target | Actual | ||
| Calibration 1 | 131,985 | ||
| Calibration 2 | 132,709 | ||
| Calibration 3 | 131,900 | ||
| ssj_ops@calibrated=132,304 | |||
| 100% | 100.5% | 132,304 | 132,946 |
| 90% | 89.7% | 119,074 | 118,736 |
| 80% | 80.0% | 105,844 | 105,868 |
| 70% | 69.8% | 92,613 | 92,373 |
| 60% | 59.9% | 79,383 | 79,196 |
| 50% | 50.5% | 66,152 | 66,803 |
| 40% | 40.3% | 52,922 | 53,350 |
| 30% | 30.0% | 39,691 | 39,750 |
| 20% | 19.7% | 26,461 | 26,074 |
| 10% | 10.0% | 13,230 | 13,170 |
| Active Idle | 0 | 0 | |