SPECpower_ssj2008
Host 'Node-9' Performance Report
Copyright © 2007-2010 Standard Performance Evaluation Corporation
| Fujitsu PRIMERGY CX120 S1 (Intel Xeon L5530) | ssj_ops@100% = 525,807 ssj_ops@100% per JVM = 131,452 |
||||
| Test Sponsor: | Fujitsu | SPEC License #: | 19 | Test Method: | Multi Node |
| Tested By: | Fujitsu | Test Location: | Paderborn, NRW, Germany | Test Date: | Mar 7, 2010 |
| Hardware Availability: | Jun-2010 | Software Availability: | Nov-2009 | Publication: | Mar 24, 2010 |
| System Source: | Single Supplier | System Designation: | Server | Power Provisioning: | Line-powered |
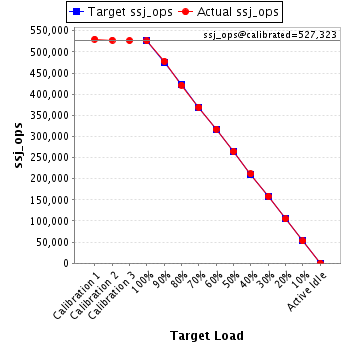
| Target Load | Actual Load | ssj_ops | |
|---|---|---|---|
| Target | Actual | ||
| Calibration 1 | 530,139 | ||
| Calibration 2 | 527,939 | ||
| Calibration 3 | 526,707 | ||
| ssj_ops@calibrated=527,323 | |||
| 100% | 99.7% | 527,323 | 525,807 |
| 90% | 90.6% | 474,591 | 477,781 |
| 80% | 79.9% | 421,859 | 421,458 |
| 70% | 70.0% | 369,126 | 369,215 |
| 60% | 60.2% | 316,394 | 317,254 |
| 50% | 50.2% | 263,662 | 264,790 |
| 40% | 40.0% | 210,929 | 211,168 |
| 30% | 30.1% | 158,197 | 158,472 |
| 20% | 19.9% | 105,465 | 104,733 |
| 10% | 10.0% | 52,732 | 52,700 |
| Active Idle | 0 | 0 | |
| Set Identifier: | SUT |
| Set Description: | Set of 38 identically configured PRIMERGY CX120 S1 servers |
| # of Identical Nodes: | 38 |
| Comment: | None |
| Hardware | |
|---|---|
| Hardware Vendor: | Fujitsu |
| Model: | PRIMERGY CX120 S1 (Intel Xeon L5530) |
| Form Factor: | 1U |
| CPU Name: | Intel Xeon L5530 |
| CPU Characteristics: | Quad-Core, 2.40GHz, 8MB L3 Cache |
| CPU Frequency (MHz): | 2400 |
| CPU(s) Enabled: | 8 cores, 2 chips, 4 cores/chip |
| Hardware Threads: | 16 (2 / core) |
| CPU(s) Orderable: | 1,2 chips |
| Primary Cache: | 32 KB I + 32 KB D on chip per core |
| Secondary Cache: | 256 KB I+D on chip per core |
| Tertiary Cache: | 8 MB I+D on chip per chip |
| Other Cache: | None |
| Memory Amount (GB): | 8 |
| # and size of DIMM: | 4 x 2048 MB |
| Memory Details: | 2GB 2Rx8 PC3-10600E ECC CL9; slots B1, C1, E1, F1 populated |
| Power Supply Quantity and Rating (W): | 1 x 400 |
| Power Supply Details: | Fujitsu Technology Solutions DPS-460GP A |
| Disk Drive: | 1 x 160GB HDD SATA (2.5", 5.4krpm) |
| Disk Controller: | Integrated SATA Controller |
| # and type of Network Interface Cards (NICs) Installed: | 2 x Intel 82576 Gigabit Network Connection (onboard) |
| NICs Enabled in Firmware / OS / Connected: | 2/1/1 |
| Network Speed (Mbit): | 1000 |
| Keyboard: | None |
| Mouse: | None |
| Monitor: | None |
| Optical Drives: | No |
| Other Hardware: | None |
| Software | |
|---|---|
| Power Management: | Enabled ("Fujitsu Enhanced Power Settings" power plan) |
| Operating System (OS): | Microsoft Windows Server 2008 R2 Enterprise |
| OS Version: | Version 6.1.7600 Build 7600 |
| Filesystem: | NTFS |
| JVM Vendor: | IBM Corporation |
| JVM Version: | IBM J9 VM (build 2.4, JRE 1.6.0 IBM J9 2.4 Windows Server 2008 amd64-64 jvmwa6460sr6-20090923_42924 (JIT enabled, AOT enabled) |
| JVM Command-line Options: | -Xaggressive -Xcompressedrefs -Xgcpolicy:gencon -Xmn1400m -Xms1550m -Xmx1550m -XlockReservation -Xnoloa -XtlhPrefetch -Xlp -Xgcthreads4 |
| JVM Affinity: | start /affinity [0x000F,0x00F0,0x0F00,0xF000] |
| JVM Instances: | 4 |
| JVM Initial Heap (MB): | 1550 |
| JVM Maximum Heap (MB): | 1550 |
| JVM Address Bits: | 64 |
| Boot Firmware Version: | 0.46 |
| Management Firmware Version: | 0.48 |
| Workload Version: | SSJ 1.2.6 |
| Director Location: | Controller |
| Other Software: | None |
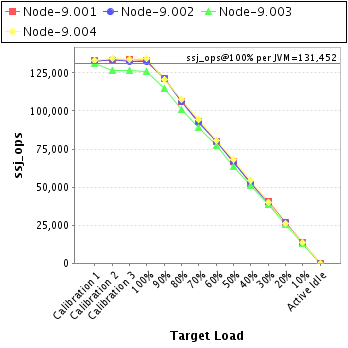
| JVM Instance | ssj_ops@100% |
|---|---|
| Node-9.001 | 133,405 |
| Node-9.002 | 132,304 |
| Node-9.003 | 125,721 |
| Node-9.004 | 134,377 |
| ssj_ops@100% | 525,807 |
| ssj_ops@100% per JVM | 131,452 |
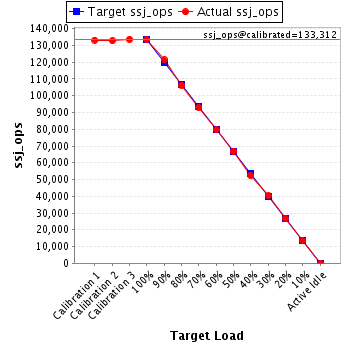
| Target Load | Actual Load | ssj_ops | |
|---|---|---|---|
| Target | Actual | ||
| Calibration 1 | 133,249 | ||
| Calibration 2 | 132,848 | ||
| Calibration 3 | 133,776 | ||
| ssj_ops@calibrated=133,312 | |||
| 100% | 100.1% | 133,312 | 133,405 |
| 90% | 91.0% | 119,981 | 121,345 |
| 80% | 79.8% | 106,649 | 106,328 |
| 70% | 69.9% | 93,318 | 93,243 |
| 60% | 59.8% | 79,987 | 79,768 |
| 50% | 50.2% | 66,656 | 66,927 |
| 40% | 39.3% | 53,325 | 52,416 |
| 30% | 30.2% | 39,994 | 40,272 |
| 20% | 20.0% | 26,662 | 26,643 |
| 10% | 10.0% | 13,331 | 13,391 |
| Active Idle | 0 | 0 | |
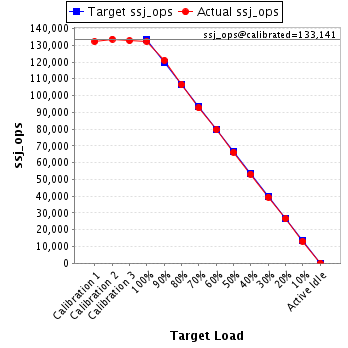
| Target Load | Actual Load | ssj_ops | |
|---|---|---|---|
| Target | Actual | ||
| Calibration 1 | 132,244 | ||
| Calibration 2 | 133,626 | ||
| Calibration 3 | 132,656 | ||
| ssj_ops@calibrated=133,141 | |||
| 100% | 99.4% | 133,141 | 132,304 |
| 90% | 90.9% | 119,827 | 120,975 |
| 80% | 79.9% | 106,513 | 106,443 |
| 70% | 69.6% | 93,198 | 92,680 |
| 60% | 59.9% | 79,884 | 79,698 |
| 50% | 49.7% | 66,570 | 66,200 |
| 40% | 39.8% | 53,256 | 53,041 |
| 30% | 29.6% | 39,942 | 39,447 |
| 20% | 20.0% | 26,628 | 26,576 |
| 10% | 9.9% | 13,314 | 13,158 |
| Active Idle | 0 | 0 | |
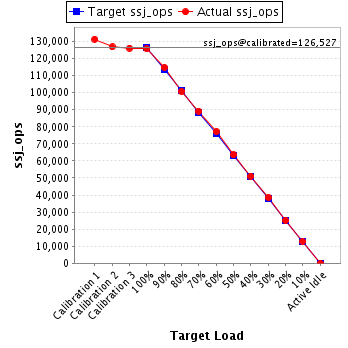
| Target Load | Actual Load | ssj_ops | |
|---|---|---|---|
| Target | Actual | ||
| Calibration 1 | 131,412 | ||
| Calibration 2 | 126,838 | ||
| Calibration 3 | 126,216 | ||
| ssj_ops@calibrated=126,527 | |||
| 100% | 99.4% | 126,527 | 125,721 |
| 90% | 90.8% | 113,875 | 114,904 |
| 80% | 79.7% | 101,222 | 100,895 |
| 70% | 70.5% | 88,569 | 89,233 |
| 60% | 61.0% | 75,916 | 77,197 |
| 50% | 50.3% | 63,264 | 63,597 |
| 40% | 40.4% | 50,611 | 51,155 |
| 30% | 30.5% | 37,958 | 38,578 |
| 20% | 19.9% | 25,305 | 25,189 |
| 10% | 10.1% | 12,653 | 12,730 |
| Active Idle | 0 | 0 | |
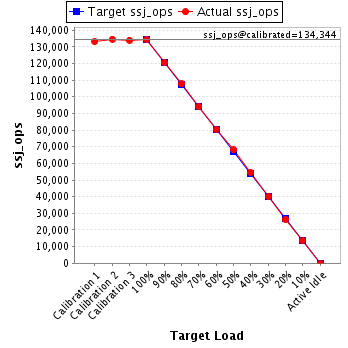
| Target Load | Actual Load | ssj_ops | |
|---|---|---|---|
| Target | Actual | ||
| Calibration 1 | 133,233 | ||
| Calibration 2 | 134,627 | ||
| Calibration 3 | 134,060 | ||
| ssj_ops@calibrated=134,344 | |||
| 100% | 100.0% | 134,344 | 134,377 |
| 90% | 89.7% | 120,909 | 120,556 |
| 80% | 80.2% | 107,475 | 107,793 |
| 70% | 70.0% | 94,041 | 94,059 |
| 60% | 60.0% | 80,606 | 80,591 |
| 50% | 50.7% | 67,172 | 68,067 |
| 40% | 40.6% | 53,737 | 54,556 |
| 30% | 29.9% | 40,303 | 40,175 |
| 20% | 19.6% | 26,869 | 26,325 |
| 10% | 10.0% | 13,434 | 13,421 |
| Active Idle | 0 | 0 | |