SPECpower_ssj2008
Host 'WIN-77M9M0Q7TKL' Performance Report
Copyright © 2007-2010 Standard Performance Evaluation Corporation
| IBM Corporation IBM System x iDataPlex dx360 M3 | ssj_ops@100% = 738,163 ssj_ops@100% per JVM = 123,027 |
||||
| Test Sponsor: | IBM Corporation | SPEC License #: | 11 | Test Method: | Multi Node |
| Tested By: | IBM Corporation | Test Location: | Nankang, Taipei, Taiwan | Test Date: | May 14, 2010 |
| Hardware Availability: | Aug-2010 | Software Availability: | Oct-2009 | Publication: | Jun 2, 2010 |
| System Source: | Single Supplier | System Designation: | Server | Power Provisioning: | Line-powered |
| Target Load | Actual Load | ssj_ops | |
|---|---|---|---|
| Target | Actual | ||
| Calibration 1 | 736,859 | ||
| Calibration 2 | 741,117 | ||
| Calibration 3 | 739,722 | ||
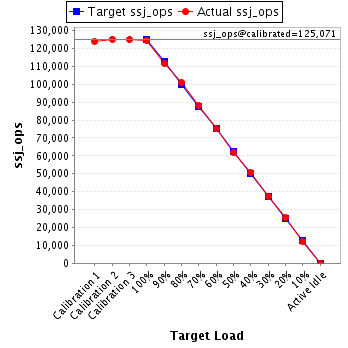
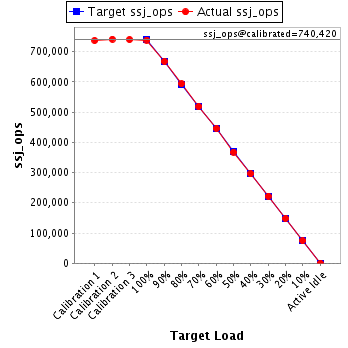
| ssj_ops@calibrated=740,420 | |||
| 100% | 99.7% | 740,420 | 738,163 |
| 90% | 90.2% | 666,378 | 667,854 |
| 80% | 80.1% | 592,336 | 593,387 |
| 70% | 70.0% | 518,294 | 518,439 |
| 60% | 60.2% | 444,252 | 445,962 |
| 50% | 49.7% | 370,210 | 367,873 |
| 40% | 39.9% | 296,168 | 295,739 |
| 30% | 30.0% | 222,126 | 222,018 |
| 20% | 20.1% | 148,084 | 148,637 |
| 10% | 10.1% | 74,042 | 74,614 |
| Active Idle | 0 | 0 | |
| Set Identifier: | sut |
| Set Description: | System Under Test |
| # of Identical Nodes: | 2 |
| Comment: | Here is a comment for this set. |
| Hardware | |
|---|---|
| Hardware Vendor: | IBM Corporation |
| Model: | IBM System x iDataPlex dx360 M3 |
| Form Factor: | 2U |
| CPU Name: | Intel Xeon L5640 |
| CPU Characteristics: | Six-Core, 2.26GHz, 12MB L3 Cache |
| CPU Frequency (MHz): | 2267 |
| CPU(s) Enabled: | 12 cores, 2 chips, 6 cores/chip |
| Hardware Threads: | 24 (2 / core) |
| CPU(s) Orderable: | 1,2 chips |
| Primary Cache: | 32 KB I + 32 KB D on chip per core |
| Secondary Cache: | 256 KB I+D on chip per core |
| Tertiary Cache: | 12 MB I+D on chip per chip |
| Other Cache: | None |
| Memory Amount (GB): | 12 |
| # and size of DIMM: | 6 x 2048 MB |
| Memory Details: | 2GB 2Rx8 PC3L-10600R; slots 3, 6, 8, 11, 14, and 16 populated |
| Power Supply Quantity and Rating (W): | None |
| Power Supply Details: | Shared |
| Disk Drive: | 1 x 50 GB SATA SSD, feature code 5197 |
| Disk Controller: | Integrated SATA controller |
| # and type of Network Interface Cards (NICs) Installed: | 2 x Integrated Intel 82575 Gigabit Ethernet Controller |
| NICs Enabled in Firmware / OS / Connected: | 1/1/1 |
| Network Speed (Mbit): | 1000 |
| Keyboard: | KVM |
| Mouse: | KVM |
| Monitor: | KVM |
| Optical Drives: | No |
| Other Hardware: | None |
| Software | |
|---|---|
| Power Management: | Power saver plan in OS |
| Operating System (OS): | Microsoft Windows Server 2008 x64 Datacenter Edition |
| OS Version: | R2 |
| Filesystem: | NTFS |
| JVM Vendor: | IBM Corporation |
| JVM Version: | IBM J9 VM (build pwa6460sr5-20090529_04(SR5)) |
| JVM Command-line Options: | -Xaggressive -Xcompressedrefs -Xgcpolicy:gencon -Xmn1100m -Xms1500m -Xmx1500m -XlockReservation -Xnoloa -XtlhPrefetch -Xlp |
| JVM Affinity: | start /affinity [F,F0,F00,F000,F0000,F00000] |
| JVM Instances: | 6 |
| JVM Initial Heap (MB): | 1500 |
| JVM Maximum Heap (MB): | 1500 |
| JVM Address Bits: | 64 |
| Boot Firmware Version: | TME148T |
| Management Firmware Version: | YUOO71A |
| Workload Version: | SSJ 1.2.6 |
| Director Location: | Controller |
| Other Software: | None |
| JVM Instance | ssj_ops@100% |
|---|---|
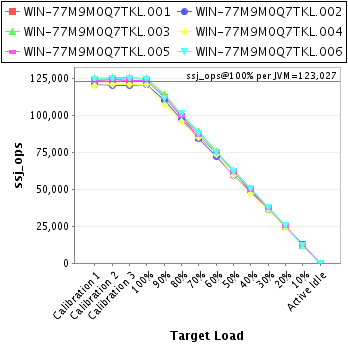
| WIN-77M9M0Q7TKL.001 | 123,441 |
| WIN-77M9M0Q7TKL.002 | 120,802 |
| WIN-77M9M0Q7TKL.003 | 124,868 |
| WIN-77M9M0Q7TKL.004 | 120,899 |
| WIN-77M9M0Q7TKL.005 | 123,598 |
| WIN-77M9M0Q7TKL.006 | 124,556 |
| ssj_ops@100% | 738,163 |
| ssj_ops@100% per JVM | 123,027 |
| Target Load | Actual Load | ssj_ops | |
|---|---|---|---|
| Target | Actual | ||
| Calibration 1 | 123,540 | ||
| Calibration 2 | 124,451 | ||
| Calibration 3 | 123,578 | ||
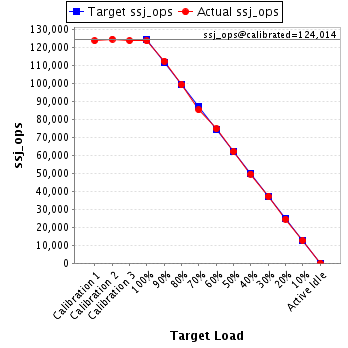
| ssj_ops@calibrated=124,014 | |||
| 100% | 99.5% | 124,014 | 123,441 |
| 90% | 90.5% | 111,613 | 112,235 |
| 80% | 79.9% | 99,212 | 99,078 |
| 70% | 68.7% | 86,810 | 85,188 |
| 60% | 60.2% | 74,409 | 74,688 |
| 50% | 50.0% | 62,007 | 62,043 |
| 40% | 40.0% | 49,606 | 49,549 |
| 30% | 30.0% | 37,204 | 37,146 |
| 20% | 19.8% | 24,803 | 24,537 |
| 10% | 10.2% | 12,401 | 12,656 |
| Active Idle | 0 | 0 | |
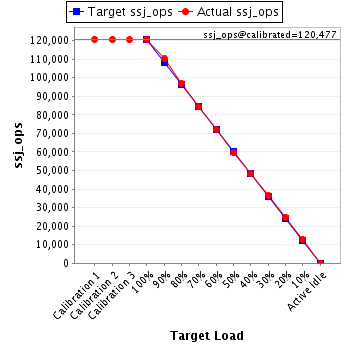
| Target Load | Actual Load | ssj_ops | |
|---|---|---|---|
| Target | Actual | ||
| Calibration 1 | 120,736 | ||
| Calibration 2 | 120,530 | ||
| Calibration 3 | 120,425 | ||
| ssj_ops@calibrated=120,477 | |||
| 100% | 100.3% | 120,477 | 120,802 |
| 90% | 91.5% | 108,430 | 110,288 |
| 80% | 80.5% | 96,382 | 97,025 |
| 70% | 69.9% | 84,334 | 84,243 |
| 60% | 60.0% | 72,286 | 72,324 |
| 50% | 49.5% | 60,239 | 59,644 |
| 40% | 40.0% | 48,191 | 48,205 |
| 30% | 30.3% | 36,143 | 36,445 |
| 20% | 20.6% | 24,095 | 24,861 |
| 10% | 10.5% | 12,048 | 12,670 |
| Active Idle | 0 | 0 | |
| Target Load | Actual Load | ssj_ops | |
|---|---|---|---|
| Target | Actual | ||
| Calibration 1 | 124,932 | ||
| Calibration 2 | 125,823 | ||
| Calibration 3 | 125,825 | ||
| ssj_ops@calibrated=125,824 | |||
| 100% | 99.2% | 125,824 | 124,868 |
| 90% | 90.4% | 113,242 | 113,786 |
| 80% | 80.0% | 100,659 | 100,667 |
| 70% | 70.8% | 88,077 | 89,047 |
| 60% | 59.9% | 75,494 | 75,332 |
| 50% | 50.1% | 62,912 | 63,037 |
| 40% | 40.3% | 50,330 | 50,657 |
| 30% | 29.5% | 37,747 | 37,101 |
| 20% | 19.9% | 25,165 | 25,070 |
| 10% | 9.7% | 12,582 | 12,203 |
| Active Idle | 0 | 0 | |

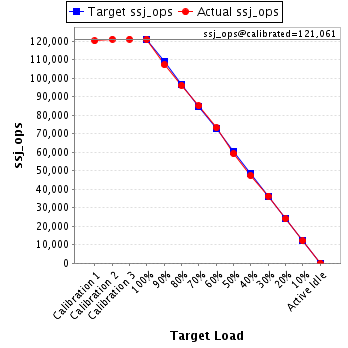
| Target Load | Actual Load | ssj_ops | |
|---|---|---|---|
| Target | Actual | ||
| Calibration 1 | 120,139 | ||
| Calibration 2 | 121,049 | ||
| Calibration 3 | 121,073 | ||
| ssj_ops@calibrated=121,061 | |||
| 100% | 99.9% | 121,061 | 120,899 |
| 90% | 88.6% | 108,955 | 107,231 |
| 80% | 79.4% | 96,849 | 96,066 |
| 70% | 70.2% | 84,743 | 85,004 |
| 60% | 60.5% | 72,637 | 73,296 |
| 50% | 48.9% | 60,530 | 59,155 |
| 40% | 39.1% | 48,424 | 47,327 |
| 30% | 30.0% | 36,318 | 36,316 |
| 20% | 19.8% | 24,212 | 23,951 |
| 10% | 10.0% | 12,106 | 12,125 |
| Active Idle | 0 | 0 | |
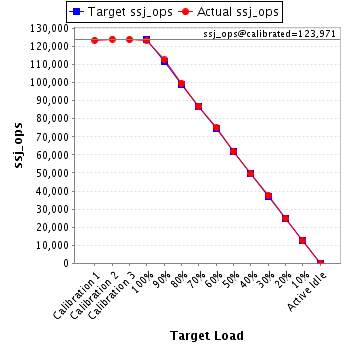
| Target Load | Actual Load | ssj_ops | |
|---|---|---|---|
| Target | Actual | ||
| Calibration 1 | 123,548 | ||
| Calibration 2 | 124,087 | ||
| Calibration 3 | 123,855 | ||
| ssj_ops@calibrated=123,971 | |||
| 100% | 99.7% | 123,971 | 123,598 |
| 90% | 90.8% | 111,574 | 112,576 |
| 80% | 80.3% | 99,177 | 99,598 |
| 70% | 70.2% | 86,780 | 87,035 |
| 60% | 60.6% | 74,383 | 75,122 |
| 50% | 50.0% | 61,986 | 61,963 |
| 40% | 39.9% | 49,588 | 49,456 |
| 30% | 30.2% | 37,191 | 37,465 |
| 20% | 20.1% | 24,794 | 24,862 |
| 10% | 10.2% | 12,397 | 12,640 |
| Active Idle | 0 | 0 | |
| Target Load | Actual Load | ssj_ops | |
|---|---|---|---|
| Target | Actual | ||
| Calibration 1 | 123,964 | ||
| Calibration 2 | 125,176 | ||
| Calibration 3 | 124,967 | ||
| ssj_ops@calibrated=125,071 | |||
| 100% | 99.6% | 125,071 | 124,556 |
| 90% | 89.3% | 112,564 | 111,739 |
| 80% | 80.7% | 100,057 | 100,954 |
| 70% | 70.3% | 87,550 | 87,921 |
| 60% | 60.1% | 75,043 | 75,200 |
| 50% | 49.6% | 62,536 | 62,031 |
| 40% | 40.4% | 50,029 | 50,545 |
| 30% | 30.0% | 37,521 | 37,544 |
| 20% | 20.3% | 25,014 | 25,356 |
| 10% | 9.9% | 12,507 | 12,321 |
| Active Idle | 0 | 0 | |