
SPECpower_ssj2008
Host 'WIN-QP5IH03EP4G' Performance Report
Copyright © 2007-2010 Standard Performance Evaluation Corporation
| Hewlett-Packard Company ProLiant DL360 G7 (2.26 GHz, Intel Xeon L5640 processor) | ssj_ops@100% = 732,062 ssj_ops@100% per JVM = 122,010 |
||||
| Test Sponsor: | Hewlett-Packard Company | SPEC License #: | 3 | Test Method: | Single Node |
| Tested By: | Hewlett-Packard Company | Test Location: | Houston, TX, USA | Test Date: | Jul 2, 2010 |
| Hardware Availability: | Sep-2010 | Software Availability: | Sep-2009 | Publication: | Jul 28, 2010 |
| System Source: | Single Supplier | System Designation: | Server | Power Provisioning: | Line-powered |
| Target Load | Actual Load | ssj_ops | |
|---|---|---|---|
| Target | Actual | ||
| Calibration 1 | 729,318 | ||
| Calibration 2 | 732,256 | ||
| Calibration 3 | 732,391 | ||
| ssj_ops@calibrated=732,324 | |||
| 100% | 100.0% | 732,324 | 732,062 |
| 90% | 90.4% | 659,091 | 661,981 |
| 80% | 80.2% | 585,859 | 587,177 |
| 70% | 69.5% | 512,627 | 509,319 |
| 60% | 60.0% | 439,394 | 439,521 |
| 50% | 49.7% | 366,162 | 363,691 |
| 40% | 40.3% | 292,929 | 295,326 |
| 30% | 30.2% | 219,697 | 221,071 |
| 20% | 20.0% | 146,465 | 146,353 |
| 10% | 10.0% | 73,232 | 73,487 |
| Active Idle | 0 | 0 | |

| Set Identifier: | sut |
| Set Description: | System Under Test |
| # of Identical Nodes: | 1 |
| Comment: | Proliant DL360 G7 |
| Hardware | |
|---|---|
| Hardware Vendor: | Hewlett-Packard Company |
| Model: | ProLiant DL360 G7 (2.26 GHz, Intel Xeon L5640 processor) |
| Form Factor: | 1U |
| CPU Name: | Intel Xeon L5640 |
| CPU Characteristics: | 6 Core, 2.26 GHz, 12 MB L3 Cache |
| CPU Frequency (MHz): | 2266 |
| CPU(s) Enabled: | 12 cores, 2 chips, 6 cores/chip |
| Hardware Threads: | 24 (2 / core) |
| CPU(s) Orderable: | 1,2 chips |
| Primary Cache: | 32 KB I + 32 KB D on chip per core |
| Secondary Cache: | 256 KB I+D on chip per core |
| Tertiary Cache: | 12 MB I+D on chip per chip |
| Other Cache: | None |
| Memory Amount (GB): | 16 |
| # and size of DIMM: | 4 x 4096 MB |
| Memory Details: | 4GB 2Rx8 PC3L-10600E; slots 3 and 6 populated on each processor |
| Power Supply Quantity and Rating (W): | 1 x 460 |
| Power Supply Details: | HP part # 503296-B21 |
| Disk Drive: | 1 x 120 GB SFF SSD SATA |
| Disk Controller: | Integrated SATA controller |
| # and type of Network Interface Cards (NICs) Installed: | 2 x Embedded HP NC382i dual-port gigabit server adapter |
| NICs Enabled in Firmware / OS / Connected: | 2/2/1 |
| Network Speed (Mbit): | 1000 |
| Keyboard: | None |
| Mouse: | None |
| Monitor: | None |
| Optical Drives: | No |
| Other Hardware: | None |
| Software | |
|---|---|
| Power Management: | Power saver enabled in OS |
| Operating System (OS): | Windows Server 2008, Enterprise Edition |
| OS Version: | R2 |
| Filesystem: | NTFS |
| JVM Vendor: | IBM Corporation |
| JVM Version: | IBM J9 VM (build 2.4, J2RE 1.6.0 IBM J9 2.4 Windows Server 2008 amd64-64 jvmwa6460sr5-20090519_35743 (JIT enabled, AOT enabled)) |
| JVM Command-line Options: | java -Xaggressive -Xcompressedrefs -Xgcpolicy:gencon -Xmn1500m -Xms1875m -Xmx1875m -XlockReservation -Xnoloa -XtlhPrefetch -Xlp |
| JVM Affinity: | start /affinity [0F,F0,F00,F000,F0000,F00000] |
| JVM Instances: | 6 |
| JVM Initial Heap (MB): | 1875 |
| JVM Maximum Heap (MB): | 1875 |
| JVM Address Bits: | 64 |
| Boot Firmware Version: | P68 5/15/2010 |
| Management Firmware Version: | 1.0 |
| Workload Version: | SSJ 1.2.6 |
| Director Location: | Controller |
| Other Software: | None |
| JVM Instance | ssj_ops@100% |
|---|---|
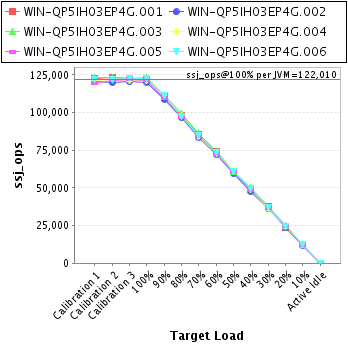
| WIN-QP5IH03EP4G.001 | 122,710 |
| WIN-QP5IH03EP4G.002 | 120,280 |
| WIN-QP5IH03EP4G.003 | 123,543 |
| WIN-QP5IH03EP4G.004 | 121,589 |
| WIN-QP5IH03EP4G.005 | 121,436 |
| WIN-QP5IH03EP4G.006 | 122,505 |
| ssj_ops@100% | 732,062 |
| ssj_ops@100% per JVM | 122,010 |
| Target Load | Actual Load | ssj_ops | |
|---|---|---|---|
| Target | Actual | ||
| Calibration 1 | 122,652 | ||
| Calibration 2 | 123,048 | ||
| Calibration 3 | 122,785 | ||
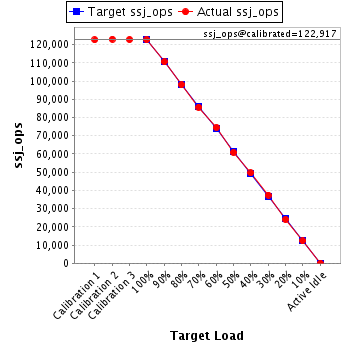
| ssj_ops@calibrated=122,917 | |||
| 100% | 99.8% | 122,917 | 122,710 |
| 90% | 89.9% | 110,625 | 110,559 |
| 80% | 79.7% | 98,333 | 97,974 |
| 70% | 69.7% | 86,042 | 85,729 |
| 60% | 60.6% | 73,750 | 74,512 |
| 50% | 49.5% | 61,458 | 60,889 |
| 40% | 40.3% | 49,167 | 49,576 |
| 30% | 30.5% | 36,875 | 37,476 |
| 20% | 19.5% | 24,583 | 24,029 |
| 10% | 10.0% | 12,292 | 12,287 |
| Active Idle | 0 | 0 | |
| Target Load | Actual Load | ssj_ops | |
|---|---|---|---|
| Target | Actual | ||
| Calibration 1 | 120,428 | ||
| Calibration 2 | 120,046 | ||
| Calibration 3 | 120,658 | ||
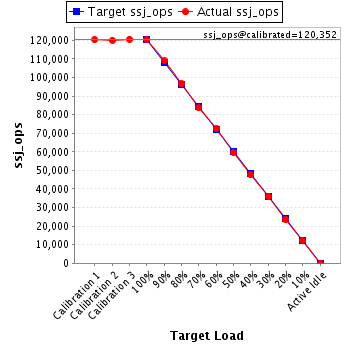
| ssj_ops@calibrated=120,352 | |||
| 100% | 99.9% | 120,352 | 120,280 |
| 90% | 90.5% | 108,317 | 108,931 |
| 80% | 80.3% | 96,282 | 96,681 |
| 70% | 69.6% | 84,246 | 83,731 |
| 60% | 60.1% | 72,211 | 72,386 |
| 50% | 49.6% | 60,176 | 59,698 |
| 40% | 39.6% | 48,141 | 47,650 |
| 30% | 30.0% | 36,106 | 36,073 |
| 20% | 19.5% | 24,070 | 23,478 |
| 10% | 10.0% | 12,035 | 12,083 |
| Active Idle | 0 | 0 | |
| Target Load | Actual Load | ssj_ops | |
|---|---|---|---|
| Target | Actual | ||
| Calibration 1 | 123,170 | ||
| Calibration 2 | 123,174 | ||
| Calibration 3 | 122,892 | ||
| ssj_ops@calibrated=123,033 | |||
| 100% | 100.4% | 123,033 | 123,543 |
| 90% | 90.5% | 110,730 | 111,370 |
| 80% | 80.9% | 98,426 | 99,530 |
| 70% | 70.0% | 86,123 | 86,126 |
| 60% | 60.1% | 73,820 | 73,888 |
| 50% | 49.4% | 61,517 | 60,779 |
| 40% | 40.8% | 49,213 | 50,140 |
| 30% | 30.3% | 36,910 | 37,286 |
| 20% | 20.3% | 24,607 | 24,939 |
| 10% | 10.3% | 12,303 | 12,681 |
| Active Idle | 0 | 0 | |

| Target Load | Actual Load | ssj_ops | |
|---|---|---|---|
| Target | Actual | ||
| Calibration 1 | 121,356 | ||
| Calibration 2 | 122,233 | ||
| Calibration 3 | 121,595 | ||
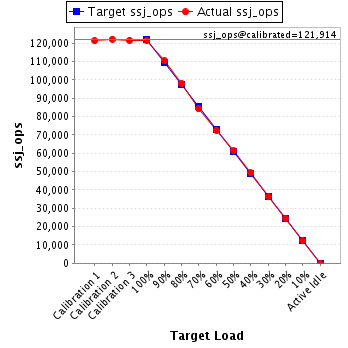
| ssj_ops@calibrated=121,914 | |||
| 100% | 99.7% | 121,914 | 121,589 |
| 90% | 90.6% | 109,723 | 110,493 |
| 80% | 80.5% | 97,531 | 98,131 |
| 70% | 69.0% | 85,340 | 84,164 |
| 60% | 59.6% | 73,148 | 72,661 |
| 50% | 50.3% | 60,957 | 61,379 |
| 40% | 40.4% | 48,766 | 49,292 |
| 30% | 29.8% | 36,574 | 36,337 |
| 20% | 20.1% | 24,383 | 24,517 |
| 10% | 10.0% | 12,191 | 12,153 |
| Active Idle | 0 | 0 | |
| Target Load | Actual Load | ssj_ops | |
|---|---|---|---|
| Target | Actual | ||
| Calibration 1 | 119,588 | ||
| Calibration 2 | 121,472 | ||
| Calibration 3 | 122,089 | ||
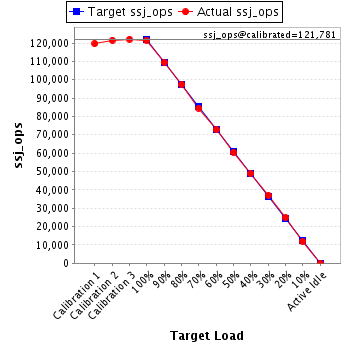
| ssj_ops@calibrated=121,781 | |||
| 100% | 99.7% | 121,781 | 121,436 |
| 90% | 89.9% | 109,603 | 109,480 |
| 80% | 80.0% | 97,425 | 97,425 |
| 70% | 69.4% | 85,247 | 84,575 |
| 60% | 59.8% | 73,069 | 72,855 |
| 50% | 49.6% | 60,890 | 60,343 |
| 40% | 40.1% | 48,712 | 48,804 |
| 30% | 30.3% | 36,534 | 36,896 |
| 20% | 20.4% | 24,356 | 24,887 |
| 10% | 9.9% | 12,178 | 12,004 |
| Active Idle | 0 | 0 | |
| Target Load | Actual Load | ssj_ops | |
|---|---|---|---|
| Target | Actual | ||
| Calibration 1 | 122,124 | ||
| Calibration 2 | 122,283 | ||
| Calibration 3 | 122,371 | ||
| ssj_ops@calibrated=122,327 | |||
| 100% | 100.1% | 122,327 | 122,505 |
| 90% | 90.9% | 110,094 | 111,148 |
| 80% | 79.7% | 97,862 | 97,436 |
| 70% | 69.5% | 85,629 | 84,993 |
| 60% | 59.9% | 73,396 | 73,219 |
| 50% | 49.5% | 61,163 | 60,603 |
| 40% | 40.8% | 48,931 | 49,865 |
| 30% | 30.2% | 36,698 | 37,003 |
| 20% | 20.0% | 24,465 | 24,502 |
| 10% | 10.0% | 12,233 | 12,279 |
| Active Idle | 0 | 0 | |
