
SPECpower_ssj2008
Host 'WIN-SSOJHFLOP15' Performance Report
Copyright © 2007-2010 Standard Performance Evaluation Corporation
| Dell Inc. PowerEdge R610 (Intel Xeon X5670, 2.93 GHz) | ssj_ops@100% = 913,806 ssj_ops@100% per JVM = 152,301 |
||||
| Test Sponsor: | Dell Inc. | SPEC License #: | 55 | Test Method: | Single Node |
| Tested By: | Dell Inc. | Test Location: | Round Rock, TX, USA | Test Date: | Jul 16, 2010 |
| Hardware Availability: | Jul-2010 | Software Availability: | Sep-2009 | Publication: | Aug 11, 2010 |
| System Source: | Single Supplier | System Designation: | Server | Power Provisioning: | Line-powered |
| Target Load | Actual Load | ssj_ops | |
|---|---|---|---|
| Target | Actual | ||
| Calibration 1 | 915,821 | ||
| Calibration 2 | 919,838 | ||
| Calibration 3 | 918,858 | ||
| ssj_ops@calibrated=919,348 | |||
| 100% | 99.4% | 919,348 | 913,806 |
| 90% | 90.0% | 827,413 | 827,265 |
| 80% | 80.1% | 735,478 | 736,085 |
| 70% | 69.8% | 643,544 | 641,988 |
| 60% | 60.1% | 551,609 | 552,488 |
| 50% | 50.1% | 459,674 | 460,146 |
| 40% | 39.9% | 367,739 | 366,782 |
| 30% | 29.9% | 275,804 | 275,182 |
| 20% | 20.0% | 183,870 | 184,066 |
| 10% | 10.0% | 91,935 | 92,263 |
| Active Idle | 0 | 0 | |

| Set Identifier: | sut |
| Set Description: | System Under Test |
| # of Identical Nodes: | 1 |
| Comment: | None |
| Hardware | |
|---|---|
| Hardware Vendor: | Dell Inc. |
| Model: | PowerEdge R610 (Intel Xeon X5670, 2.93 GHz) |
| Form Factor: | 1U |
| CPU Name: | Intel Xeon X5670 |
| CPU Characteristics: | Six Core, 2.93 GHz, 12 MB L3 Cache |
| CPU Frequency (MHz): | 2933 |
| CPU(s) Enabled: | 12 cores, 2 chips, 6 cores/chip |
| Hardware Threads: | 24 (2 / core) |
| CPU(s) Orderable: | 1,2 chips |
| Primary Cache: | 32 KB I + 32 KB D on chip per core |
| Secondary Cache: | 256 KB I+D on chip per core |
| Tertiary Cache: | 12 MB I+D on chip per chip |
| Other Cache: | None |
| Memory Amount (GB): | 12 |
| # and size of DIMM: | 6 x 2048 MB |
| Memory Details: | 2GB 2Rx8 PC3L-10600E ECC; slots A1-A3 and B1-B3 populated |
| Power Supply Quantity and Rating (W): | 1 x 502 |
| Power Supply Details: | Dell PN KY091 |
| Disk Drive: | 1 x 50GB SSD 2.5" SATA (Dell PN Y949P) |
| Disk Controller: | PERC H200 Integrated |
| # and type of Network Interface Cards (NICs) Installed: | 2 x dual-port onboard Broadcom NetXtreme II BCM5709C |
| NICs Enabled in Firmware / OS / Connected: | 2/2/1 |
| Network Speed (Mbit): | 1000 |
| Keyboard: | None |
| Mouse: | None |
| Monitor: | None |
| Optical Drives: | No |
| Other Hardware: | None |
| Software | |
|---|---|
| Power Management: | Power Saver in OS (See Notes) |
| Operating System (OS): | Microsoft Windows 2008 Server Enterprise x64 Edition |
| OS Version: | R2 |
| Filesystem: | NTFS |
| JVM Vendor: | IBM Corporation |
| JVM Version: | IBM J9 VM (build 2.4, J2RE 1.6.0 IBM J9 2.4 Windows Server 2008 amd64-64 jvmwa660sr5-20090519_35743 (JIT enabled, AOT enabled)) |
| JVM Command-line Options: | -Xms1500m -Xmx1500m -Xmn1100m -Xaggressive -Xcompressedrefs -Xgcpolicy:gencon -XlockReservation -Xnoloa -XtlhPrefetch -Xlp |
| JVM Affinity: | start /affinity [F,F0,F00,F000,F0000,F00000] |
| JVM Instances: | 6 |
| JVM Initial Heap (MB): | 1500 |
| JVM Maximum Heap (MB): | 1500 |
| JVM Address Bits: | 64 |
| Boot Firmware Version: | 2.1.9 |
| Management Firmware Version: | 1.5.0 A02 |
| Workload Version: | SSJ 1.2.6 |
| Director Location: | Controller |
| Other Software: | None |
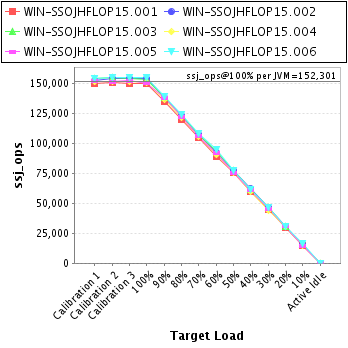
| JVM Instance | ssj_ops@100% |
|---|---|
| WIN-SSOJHFLOP15.001 | 150,169 |
| WIN-SSOJHFLOP15.002 | 154,222 |
| WIN-SSOJHFLOP15.003 | 153,277 |
| WIN-SSOJHFLOP15.004 | 150,848 |
| WIN-SSOJHFLOP15.005 | 150,360 |
| WIN-SSOJHFLOP15.006 | 154,931 |
| ssj_ops@100% | 913,806 |
| ssj_ops@100% per JVM | 152,301 |
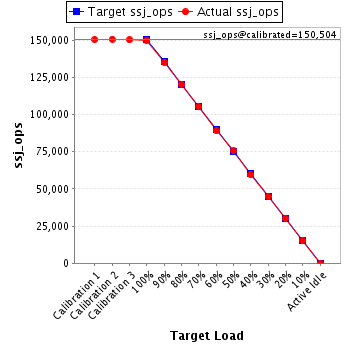
| Target Load | Actual Load | ssj_ops | |
|---|---|---|---|
| Target | Actual | ||
| Calibration 1 | 150,470 | ||
| Calibration 2 | 150,738 | ||
| Calibration 3 | 150,270 | ||
| ssj_ops@calibrated=150,504 | |||
| 100% | 99.8% | 150,504 | 150,169 |
| 90% | 89.8% | 135,453 | 135,163 |
| 80% | 80.0% | 120,403 | 120,443 |
| 70% | 70.1% | 105,353 | 105,483 |
| 60% | 59.2% | 90,302 | 89,098 |
| 50% | 50.2% | 75,252 | 75,614 |
| 40% | 39.6% | 60,202 | 59,569 |
| 30% | 29.8% | 45,151 | 44,897 |
| 20% | 20.1% | 30,101 | 30,225 |
| 10% | 10.0% | 15,050 | 15,057 |
| Active Idle | 0 | 0 | |
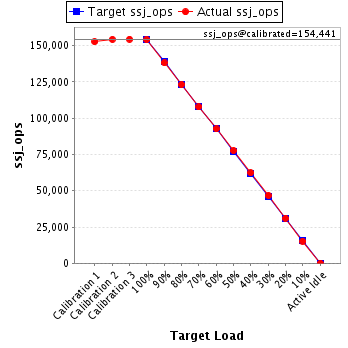
| Target Load | Actual Load | ssj_ops | |
|---|---|---|---|
| Target | Actual | ||
| Calibration 1 | 152,708 | ||
| Calibration 2 | 154,365 | ||
| Calibration 3 | 154,517 | ||
| ssj_ops@calibrated=154,441 | |||
| 100% | 99.9% | 154,441 | 154,222 |
| 90% | 89.5% | 138,997 | 138,150 |
| 80% | 79.7% | 123,553 | 123,151 |
| 70% | 69.8% | 108,109 | 107,767 |
| 60% | 60.0% | 92,665 | 92,669 |
| 50% | 50.3% | 77,220 | 77,683 |
| 40% | 40.3% | 61,776 | 62,302 |
| 30% | 30.2% | 46,332 | 46,689 |
| 20% | 20.1% | 30,888 | 31,104 |
| 10% | 9.9% | 15,444 | 15,287 |
| Active Idle | 0 | 0 | |
| Target Load | Actual Load | ssj_ops | |
|---|---|---|---|
| Target | Actual | ||
| Calibration 1 | 154,631 | ||
| Calibration 2 | 155,302 | ||
| Calibration 3 | 154,653 | ||
| ssj_ops@calibrated=154,978 | |||
| 100% | 98.9% | 154,978 | 153,277 |
| 90% | 89.6% | 139,480 | 138,934 |
| 80% | 79.9% | 123,982 | 123,862 |
| 70% | 69.7% | 108,484 | 107,982 |
| 60% | 60.3% | 92,987 | 93,522 |
| 50% | 50.1% | 77,489 | 77,636 |
| 40% | 39.9% | 61,991 | 61,866 |
| 30% | 30.1% | 46,493 | 46,658 |
| 20% | 19.7% | 30,996 | 30,596 |
| 10% | 10.2% | 15,498 | 15,847 |
| Active Idle | 0 | 0 | |

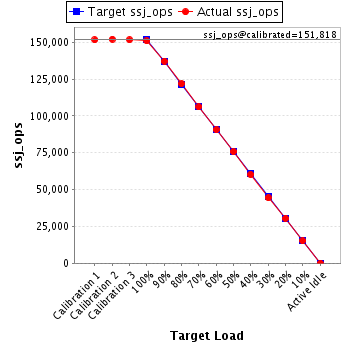
| Target Load | Actual Load | ssj_ops | |
|---|---|---|---|
| Target | Actual | ||
| Calibration 1 | 151,550 | ||
| Calibration 2 | 152,087 | ||
| Calibration 3 | 151,549 | ||
| ssj_ops@calibrated=151,818 | |||
| 100% | 99.4% | 151,818 | 150,848 |
| 90% | 90.4% | 136,637 | 137,206 |
| 80% | 80.2% | 121,455 | 121,717 |
| 70% | 69.9% | 106,273 | 106,057 |
| 60% | 59.7% | 91,091 | 90,612 |
| 50% | 49.9% | 75,909 | 75,724 |
| 40% | 39.6% | 60,727 | 60,185 |
| 30% | 29.2% | 45,546 | 44,389 |
| 20% | 20.1% | 30,364 | 30,517 |
| 10% | 10.0% | 15,182 | 15,167 |
| Active Idle | 0 | 0 | |
| Target Load | Actual Load | ssj_ops | |
|---|---|---|---|
| Target | Actual | ||
| Calibration 1 | 152,023 | ||
| Calibration 2 | 151,818 | ||
| Calibration 3 | 152,594 | ||
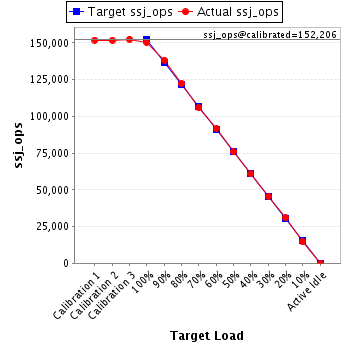
| ssj_ops@calibrated=152,206 | |||
| 100% | 98.8% | 152,206 | 150,360 |
| 90% | 90.8% | 136,985 | 138,279 |
| 80% | 80.4% | 121,765 | 122,312 |
| 70% | 69.7% | 106,544 | 106,100 |
| 60% | 60.3% | 91,324 | 91,777 |
| 50% | 49.8% | 76,103 | 75,860 |
| 40% | 40.0% | 60,882 | 60,903 |
| 30% | 29.9% | 45,662 | 45,575 |
| 20% | 20.3% | 30,441 | 30,912 |
| 10% | 9.7% | 15,221 | 14,793 |
| Active Idle | 0 | 0 | |
| Target Load | Actual Load | ssj_ops | |
|---|---|---|---|
| Target | Actual | ||
| Calibration 1 | 154,439 | ||
| Calibration 2 | 155,527 | ||
| Calibration 3 | 155,275 | ||
| ssj_ops@calibrated=155,401 | |||
| 100% | 99.7% | 155,401 | 154,931 |
| 90% | 89.8% | 139,861 | 139,534 |
| 80% | 80.2% | 124,321 | 124,601 |
| 70% | 69.9% | 108,781 | 108,599 |
| 60% | 61.0% | 93,241 | 94,810 |
| 50% | 50.0% | 77,701 | 77,628 |
| 40% | 39.9% | 62,160 | 61,957 |
| 30% | 30.2% | 46,620 | 46,976 |
| 20% | 19.8% | 31,080 | 30,712 |
| 10% | 10.4% | 15,540 | 16,112 |
| Active Idle | 0 | 0 | |
