SPECpower_ssj2008
Host 'CLASSIC2' Performance Report
Copyright © 2007-2010 Standard Performance Evaluation Corporation
| NEC Corporation Express5800/R120b-1 | ssj_ops@100% = 808,778 ssj_ops@100% per JVM = 134,796 |
||||
| Test Sponsor: | NEC Corporation | SPEC License #: | 9006 | Test Method: | Single Node |
| Tested By: | NEC Corporation | Test Location: | Fuchu, Tokyo, Japan | Test Date: | Aug 10, 2010 |
| Hardware Availability: | Jun-2010 | Software Availability: | Feb-2010 | Publication: | Sep 9, 2010 |
| System Source: | Single Supplier | System Designation: | Server | Power Provisioning: | Line-powered |
| Target Load | Actual Load | ssj_ops | |
|---|---|---|---|
| Target | Actual | ||
| Calibration 1 | 813,456 | ||
| Calibration 2 | 809,207 | ||
| Calibration 3 | 810,501 | ||
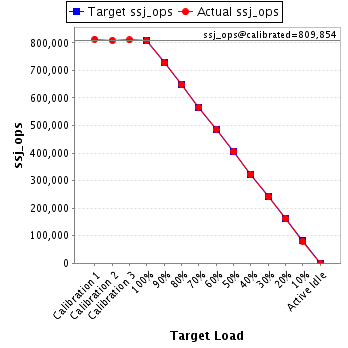
| ssj_ops@calibrated=809,854 | |||
| 100% | 99.9% | 809,854 | 808,778 |
| 90% | 89.8% | 728,868 | 727,513 |
| 80% | 79.9% | 647,883 | 647,181 |
| 70% | 69.9% | 566,898 | 566,302 |
| 60% | 60.1% | 485,912 | 486,321 |
| 50% | 49.9% | 404,927 | 404,175 |
| 40% | 39.9% | 323,941 | 322,763 |
| 30% | 29.9% | 242,956 | 242,440 |
| 20% | 20.0% | 161,971 | 162,033 |
| 10% | 10.0% | 80,985 | 80,695 |
| Active Idle | 0 | 0 | |
| Set Identifier: | sut |
| Set Description: | Express5800/R120b-1 (Intel Xeon X5670, 2.93 GHz) |
| # of Identical Nodes: | 1 |
| Comment: | None |
| Hardware | |
|---|---|
| Hardware Vendor: | NEC Corporation |
| Model: | Express5800/R120b-1 |
| Form Factor: | 1U |
| CPU Name: | Intel Xeon X5670 |
| CPU Characteristics: | Hexa-Core, 2.93 GHz, 12 MB L3 Cache |
| CPU Frequency (MHz): | 2933 |
| CPU(s) Enabled: | 12 cores, 2 chips, 6 cores/chip |
| Hardware Threads: | 24 (2 / core) |
| CPU(s) Orderable: | 1,2 chips |
| Primary Cache: | 32 KB I + 32 KB D on chip per core |
| Secondary Cache: | 256 KB I+D on chip per core |
| Tertiary Cache: | 12 MB I+D on chip per chip |
| Other Cache: | None |
| Memory Amount (GB): | 16 |
| # and size of DIMM: | 4 x 4096 MB |
| Memory Details: | 4GB 2Rx4 PC3L-10600R ECC CL9; slots CPU1_DIMM1, CPU1_DIMM2, CPU2_DIMM1 and CPU2_DIMM2 populated |
| Power Supply Quantity and Rating (W): | 1 x 650 |
| Power Supply Details: | Delta DPS-650RB |
| Disk Drive: | 1 x 50GB SSD SATA, NEC P/N:N8150-702 |
| Disk Controller: | Integrated SATA controller |
| # and type of Network Interface Cards (NICs) Installed: | 1 x Integrated Intel 82576 Gigabit Dual Port Ethernet Controller |
| NICs Enabled in Firmware / OS / Connected: | 2/1/1 |
| Network Speed (Mbit): | 1000 |
| Keyboard: | None |
| Mouse: | None |
| Monitor: | None |
| Optical Drives: | No |
| Other Hardware: | None |
| Software | |
|---|---|
| Power Management: | Power saver |
| Operating System (OS): | Microsoft Windows Server 2008 Enterprise x64 Edition |
| OS Version: | SP2 |
| Filesystem: | NTFS |
| JVM Vendor: | Oracle Corporation |
| JVM Version: | Oracle JRockit(R) 6 P28.0.0 (build P28.0.0-29_BR8175970_BR9402966-129478-1.6.0_11-20100223-1645-windows-x86_64) |
| JVM Command-line Options: | -Xms2400m -Xmx2400m -Xns2200m -XXaggressive -Xlargepages -Xgc:genpar -XXcallprofiling -XXgcthreads=2 -XXtlasize:min=4k,preferred=1024k |
| JVM Affinity: | start /affinity [F,F0,F00,F000,F0000,F00000] |
| JVM Instances: | 6 |
| JVM Initial Heap (MB): | 2400 |
| JVM Maximum Heap (MB): | 2400 |
| JVM Address Bits: | 64 |
| Boot Firmware Version: | 4.6.0C12 |
| Management Firmware Version: | 1.26 |
| Workload Version: | SSJ 1.2.6 |
| Director Location: | Controller |
| Other Software: | None |
| JVM Instance | ssj_ops@100% |
|---|---|
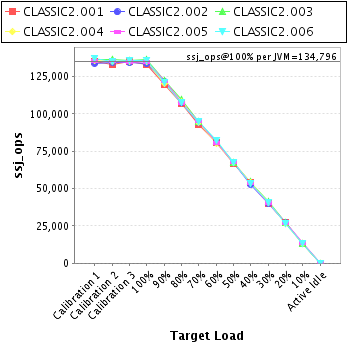
| CLASSIC2.001 | 133,064 |
| CLASSIC2.002 | 133,558 |
| CLASSIC2.003 | 136,343 |
| CLASSIC2.004 | 134,761 |
| CLASSIC2.005 | 135,038 |
| CLASSIC2.006 | 136,014 |
| ssj_ops@100% | 808,778 |
| ssj_ops@100% per JVM | 134,796 |
| Target Load | Actual Load | ssj_ops | |
|---|---|---|---|
| Target | Actual | ||
| Calibration 1 | 135,075 | ||
| Calibration 2 | 133,045 | ||
| Calibration 3 | 134,781 | ||
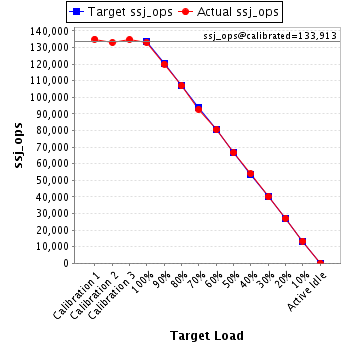
| ssj_ops@calibrated=133,913 | |||
| 100% | 99.4% | 133,913 | 133,064 |
| 90% | 89.6% | 120,521 | 119,998 |
| 80% | 79.9% | 107,130 | 107,025 |
| 70% | 69.3% | 93,739 | 92,736 |
| 60% | 60.2% | 80,348 | 80,615 |
| 50% | 49.7% | 66,956 | 66,617 |
| 40% | 40.3% | 53,565 | 53,991 |
| 30% | 30.0% | 40,174 | 40,113 |
| 20% | 20.3% | 26,783 | 27,159 |
| 10% | 10.0% | 13,391 | 13,387 |
| Active Idle | 0 | 0 | |
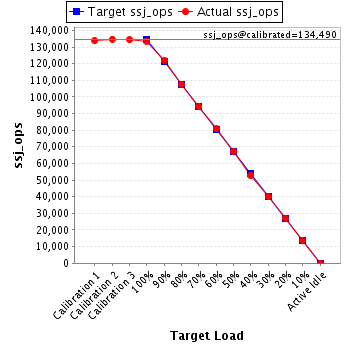
| Target Load | Actual Load | ssj_ops | |
|---|---|---|---|
| Target | Actual | ||
| Calibration 1 | 133,820 | ||
| Calibration 2 | 134,711 | ||
| Calibration 3 | 134,269 | ||
| ssj_ops@calibrated=134,490 | |||
| 100% | 99.3% | 134,490 | 133,558 |
| 90% | 90.5% | 121,041 | 121,765 |
| 80% | 79.9% | 107,592 | 107,515 |
| 70% | 69.9% | 94,143 | 94,049 |
| 60% | 60.0% | 80,694 | 80,724 |
| 50% | 50.1% | 67,245 | 67,387 |
| 40% | 39.3% | 53,796 | 52,907 |
| 30% | 29.7% | 40,347 | 39,916 |
| 20% | 20.1% | 26,898 | 26,982 |
| 10% | 10.1% | 13,449 | 13,555 |
| Active Idle | 0 | 0 | |
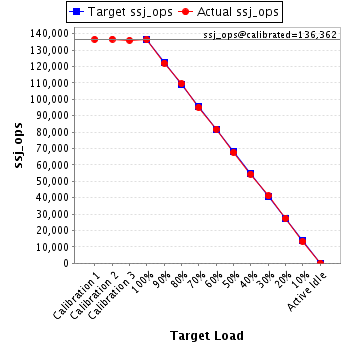
| Target Load | Actual Load | ssj_ops | |
|---|---|---|---|
| Target | Actual | ||
| Calibration 1 | 136,569 | ||
| Calibration 2 | 136,676 | ||
| Calibration 3 | 136,049 | ||
| ssj_ops@calibrated=136,362 | |||
| 100% | 100.0% | 136,362 | 136,343 |
| 90% | 89.5% | 122,726 | 122,080 |
| 80% | 80.3% | 109,090 | 109,460 |
| 70% | 69.7% | 95,454 | 95,080 |
| 60% | 60.0% | 81,817 | 81,808 |
| 50% | 49.6% | 68,181 | 67,632 |
| 40% | 39.9% | 54,545 | 54,402 |
| 30% | 30.1% | 40,909 | 41,058 |
| 20% | 20.1% | 27,272 | 27,458 |
| 10% | 9.8% | 13,636 | 13,337 |
| Active Idle | 0 | 0 | |
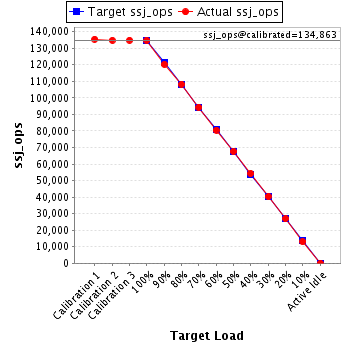
| Target Load | Actual Load | ssj_ops | |
|---|---|---|---|
| Target | Actual | ||
| Calibration 1 | 135,470 | ||
| Calibration 2 | 134,805 | ||
| Calibration 3 | 134,922 | ||
| ssj_ops@calibrated=134,863 | |||
| 100% | 99.9% | 134,863 | 134,761 |
| 90% | 89.2% | 121,377 | 120,276 |
| 80% | 80.3% | 107,891 | 108,321 |
| 70% | 69.9% | 94,404 | 94,315 |
| 60% | 59.7% | 80,918 | 80,507 |
| 50% | 50.2% | 67,432 | 67,683 |
| 40% | 40.3% | 53,945 | 54,335 |
| 30% | 29.9% | 40,459 | 40,377 |
| 20% | 20.0% | 26,973 | 26,917 |
| 10% | 9.7% | 13,486 | 13,066 |
| Active Idle | 0 | 0 | |
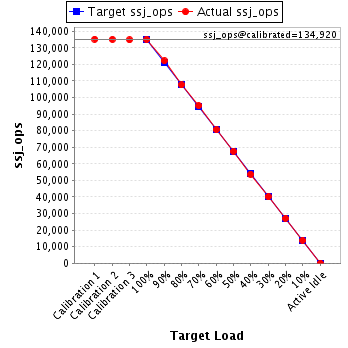
| Target Load | Actual Load | ssj_ops | |
|---|---|---|---|
| Target | Actual | ||
| Calibration 1 | 135,228 | ||
| Calibration 2 | 135,103 | ||
| Calibration 3 | 134,737 | ||
| ssj_ops@calibrated=134,920 | |||
| 100% | 100.1% | 134,920 | 135,038 |
| 90% | 90.5% | 121,428 | 122,114 |
| 80% | 79.7% | 107,936 | 107,572 |
| 70% | 70.5% | 94,444 | 95,111 |
| 60% | 59.8% | 80,952 | 80,667 |
| 50% | 50.1% | 67,460 | 67,646 |
| 40% | 39.8% | 53,968 | 53,694 |
| 30% | 29.7% | 40,476 | 40,110 |
| 20% | 20.1% | 26,984 | 27,142 |
| 10% | 10.3% | 13,492 | 13,896 |
| Active Idle | 0 | 0 | |
| Target Load | Actual Load | ssj_ops | |
|---|---|---|---|
| Target | Actual | ||
| Calibration 1 | 137,294 | ||
| Calibration 2 | 134,868 | ||
| Calibration 3 | 135,743 | ||
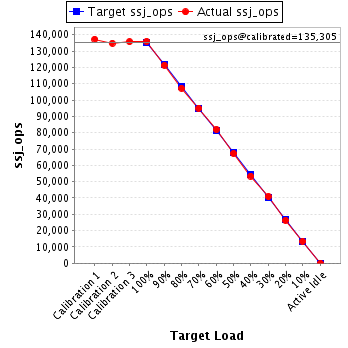
| ssj_ops@calibrated=135,305 | |||
| 100% | 100.5% | 135,305 | 136,014 |
| 90% | 89.6% | 121,775 | 121,281 |
| 80% | 79.3% | 108,244 | 107,289 |
| 70% | 70.2% | 94,714 | 95,011 |
| 60% | 60.6% | 81,183 | 82,001 |
| 50% | 49.7% | 67,653 | 67,210 |
| 40% | 39.5% | 54,122 | 53,434 |
| 30% | 30.2% | 40,592 | 40,867 |
| 20% | 19.5% | 27,061 | 26,375 |
| 10% | 9.9% | 13,531 | 13,454 |
| Active Idle | 0 | 0 | |