| Target Load |
Actual Load |
ssj_ops |
| Target |
Actual |
| Calibration 1 |
|
|
1,855,233 |
| Calibration 2 |
|
|
1,873,923 |
| Calibration 3 |
|
|
1,875,478 |
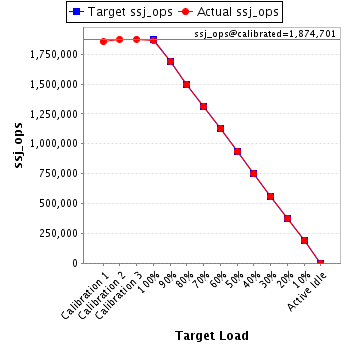
| ssj_ops@calibrated=1,874,701 |
| 100% |
99.4% |
1,874,701 |
1,862,600 |
| 90% |
90.0% |
1,687,231 |
1,687,471 |
| 80% |
79.8% |
1,499,760 |
1,496,387 |
| 70% |
70.0% |
1,312,290 |
1,311,952 |
| 60% |
60.2% |
1,124,820 |
1,128,201 |
| 50% |
50.0% |
937,350 |
937,542 |
| 40% |
39.9% |
749,880 |
747,806 |
| 30% |
29.9% |
562,410 |
559,804 |
| 20% |
20.0% |
374,940 |
375,170 |
| 10% |
10.0% |
187,470 |
187,968 |
| Active Idle |
|
0 |
0 |
| Hardware |
| Hardware Vendor: |
NEC Corporation |
| Model: |
Express5800/R140b-4 |
| Form Factor: |
4U |
| CPU Name: |
Intel Xeon X7560 |
| CPU Characteristics: |
Octa-Core, 2.26 GHz, 24 MB L3 Cache |
| CPU Frequency (MHz): |
2266 |
| CPU(s) Enabled: |
32 cores, 4 chips, 8 cores/chip |
| Hardware Threads: |
64 (2 / core) |
| CPU(s) Orderable: |
2,4 chips |
| Primary Cache: |
32 KB I + 32 KB D on chip per core |
| Secondary Cache: |
256 KB I+D on chip per core |
| Tertiary Cache: |
24 MB I+D on chip per chip |
| Other Cache: |
None |
| Memory Amount (GB): |
128 |
| # and size of DIMM: |
16 x 8192 MB |
| Memory Details: |
8GB 2Rx4 PC3-10600R ECC CL9; slots DIMM 1A, DIMM 1B, DIMM 1C and DIMM 1D populated on each Memory Back Board |
| Power Supply Quantity and Rating (W): |
2 x 850 |
| Power Supply Details: |
Delta DPS-850FB |
| Disk Drive: |
1 x 50GB SSD SATA, NEC P/N:N8150-703 |
| Disk Controller: |
RAID Controller, NEC P/N:N8103-130 |
| # and type of Network Interface Cards (NICs) Installed: |
2 x Integrated Intel 82576 Gigabit Dual Port Ethernet Controller |
| NICs Enabled in Firmware / OS / Connected: |
4/1/1 |
| Network Speed (Mbit): |
1000 |
| Keyboard: |
None |
| Mouse: |
None |
| Monitor: |
None |
| Optical Drives: |
No |
| Other Hardware: |
1 x Additional Memory Back Board, NEC P/N:N8102-345 |
| JVM Instance |
ssj_ops@100% |
| R140b-4.001 |
58,386 |
| R140b-4.002 |
56,774 |
| R140b-4.003 |
58,612 |
| R140b-4.004 |
57,937 |
| R140b-4.005 |
59,081 |
| R140b-4.006 |
57,977 |
| R140b-4.007 |
55,464 |
| R140b-4.008 |
58,584 |
| R140b-4.009 |
58,293 |
| R140b-4.010 |
55,327 |
| R140b-4.011 |
58,518 |
| R140b-4.012 |
59,454 |
| R140b-4.013 |
58,617 |
| R140b-4.014 |
59,340 |
| R140b-4.015 |
59,010 |
| R140b-4.016 |
59,004 |
| R140b-4.017 |
59,318 |
| R140b-4.018 |
58,911 |
| R140b-4.019 |
57,954 |
| R140b-4.020 |
58,593 |
| R140b-4.021 |
58,668 |
| R140b-4.022 |
56,278 |
| R140b-4.023 |
56,073 |
| R140b-4.024 |
58,330 |
| R140b-4.025 |
59,330 |
| R140b-4.026 |
59,581 |
| R140b-4.027 |
58,462 |
| R140b-4.028 |
56,171 |
| R140b-4.029 |
58,951 |
| R140b-4.030 |
58,581 |
| R140b-4.031 |
58,756 |
| R140b-4.032 |
58,265 |
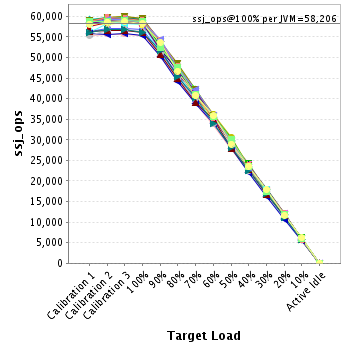
| ssj_ops@100% |
1,862,600 |
| ssj_ops@100% per JVM |
58,206 |
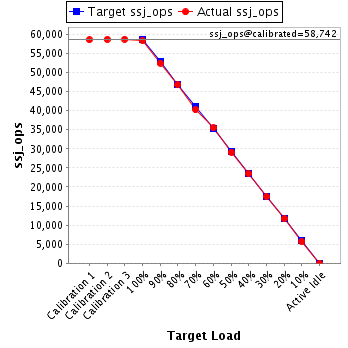
JVM 'R140b-4.001' Scores:
| Target Load |
Actual Load |
ssj_ops |
| Target |
Actual |
| Calibration 1 |
|
|
58,589 |
| Calibration 2 |
|
|
58,723 |
| Calibration 3 |
|
|
58,762 |
| ssj_ops@calibrated=58,742 |
| 100% |
99.4% |
58,742 |
58,386 |
| 90% |
89.4% |
52,868 |
52,505 |
| 80% |
79.6% |
46,994 |
46,782 |
| 70% |
68.5% |
41,120 |
40,243 |
| 60% |
60.4% |
35,245 |
35,472 |
| 50% |
49.6% |
29,371 |
29,115 |
| 40% |
40.1% |
23,497 |
23,535 |
| 30% |
29.7% |
17,623 |
17,464 |
| 20% |
19.9% |
11,748 |
11,677 |
| 10% |
9.6% |
5,874 |
5,658 |
| Active Idle |
|
0 |
0 |
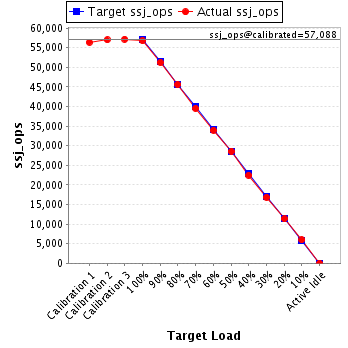
JVM 'R140b-4.002' Scores:
| Target Load |
Actual Load |
ssj_ops |
| Target |
Actual |
| Calibration 1 |
|
|
56,423 |
| Calibration 2 |
|
|
57,000 |
| Calibration 3 |
|
|
57,176 |
| ssj_ops@calibrated=57,088 |
| 100% |
99.5% |
57,088 |
56,774 |
| 90% |
89.7% |
51,379 |
51,213 |
| 80% |
79.9% |
45,670 |
45,587 |
| 70% |
69.2% |
39,961 |
39,504 |
| 60% |
59.5% |
34,253 |
33,958 |
| 50% |
50.0% |
28,544 |
28,531 |
| 40% |
39.3% |
22,835 |
22,458 |
| 30% |
29.5% |
17,126 |
16,837 |
| 20% |
19.9% |
11,418 |
11,333 |
| 10% |
10.5% |
5,709 |
5,987 |
| Active Idle |
|
0 |
0 |
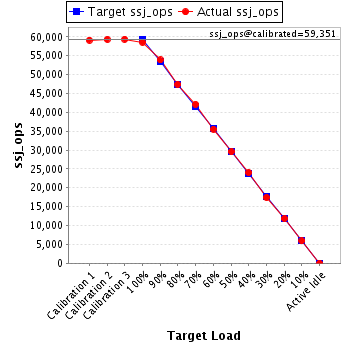
JVM 'R140b-4.003' Scores:
| Target Load |
Actual Load |
ssj_ops |
| Target |
Actual |
| Calibration 1 |
|
|
59,150 |
| Calibration 2 |
|
|
59,323 |
| Calibration 3 |
|
|
59,379 |
| ssj_ops@calibrated=59,351 |
| 100% |
98.8% |
59,351 |
58,612 |
| 90% |
90.8% |
53,416 |
53,862 |
| 80% |
79.9% |
47,481 |
47,402 |
| 70% |
71.0% |
41,546 |
42,131 |
| 60% |
59.9% |
35,611 |
35,556 |
| 50% |
49.8% |
29,676 |
29,578 |
| 40% |
40.4% |
23,740 |
24,006 |
| 30% |
29.4% |
17,805 |
17,438 |
| 20% |
20.0% |
11,870 |
11,853 |
| 10% |
10.0% |
5,935 |
5,939 |
| Active Idle |
|
0 |
0 |
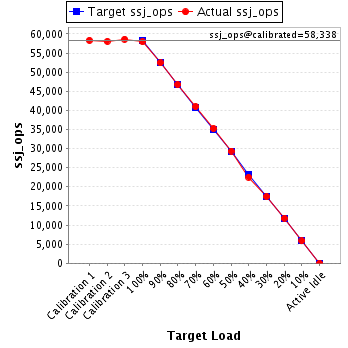
JVM 'R140b-4.004' Scores:
| Target Load |
Actual Load |
ssj_ops |
| Target |
Actual |
| Calibration 1 |
|
|
58,355 |
| Calibration 2 |
|
|
58,055 |
| Calibration 3 |
|
|
58,622 |
| ssj_ops@calibrated=58,338 |
| 100% |
99.3% |
58,338 |
57,937 |
| 90% |
89.9% |
52,505 |
52,456 |
| 80% |
80.1% |
46,671 |
46,735 |
| 70% |
70.3% |
40,837 |
41,021 |
| 60% |
60.4% |
35,003 |
35,264 |
| 50% |
50.3% |
29,169 |
29,352 |
| 40% |
38.6% |
23,335 |
22,525 |
| 30% |
29.9% |
17,502 |
17,467 |
| 20% |
20.2% |
11,668 |
11,804 |
| 10% |
10.0% |
5,834 |
5,852 |
| Active Idle |
|
0 |
0 |
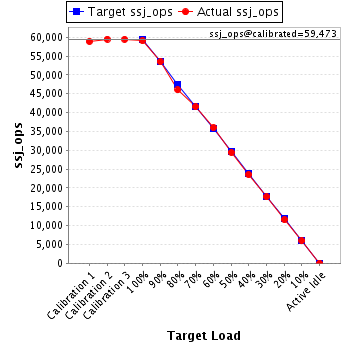
JVM 'R140b-4.005' Scores:
| Target Load |
Actual Load |
ssj_ops |
| Target |
Actual |
| Calibration 1 |
|
|
58,888 |
| Calibration 2 |
|
|
59,490 |
| Calibration 3 |
|
|
59,455 |
| ssj_ops@calibrated=59,473 |
| 100% |
99.3% |
59,473 |
59,081 |
| 90% |
89.9% |
53,525 |
53,493 |
| 80% |
77.4% |
47,578 |
46,003 |
| 70% |
69.9% |
41,631 |
41,542 |
| 60% |
60.5% |
35,684 |
35,973 |
| 50% |
49.5% |
29,736 |
29,415 |
| 40% |
39.6% |
23,789 |
23,545 |
| 30% |
29.6% |
17,842 |
17,614 |
| 20% |
19.4% |
11,895 |
11,558 |
| 10% |
10.1% |
5,947 |
5,983 |
| Active Idle |
|
0 |
0 |
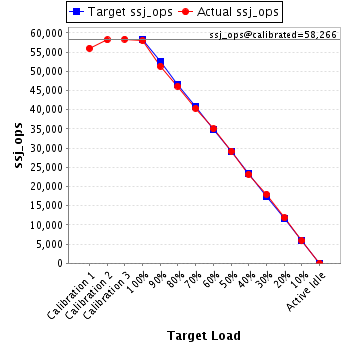
JVM 'R140b-4.006' Scores:
| Target Load |
Actual Load |
ssj_ops |
| Target |
Actual |
| Calibration 1 |
|
|
55,984 |
| Calibration 2 |
|
|
58,172 |
| Calibration 3 |
|
|
58,360 |
| ssj_ops@calibrated=58,266 |
| 100% |
99.5% |
58,266 |
57,977 |
| 90% |
88.1% |
52,439 |
51,345 |
| 80% |
79.1% |
46,613 |
46,093 |
| 70% |
69.3% |
40,786 |
40,364 |
| 60% |
60.0% |
34,960 |
34,985 |
| 50% |
50.0% |
29,133 |
29,156 |
| 40% |
39.8% |
23,306 |
23,161 |
| 30% |
30.8% |
17,480 |
17,958 |
| 20% |
20.3% |
11,653 |
11,854 |
| 10% |
10.1% |
5,827 |
5,892 |
| Active Idle |
|
0 |
0 |
JVM 'R140b-4.007' Scores:
| Target Load |
Actual Load |
ssj_ops |
| Target |
Actual |
| Calibration 1 |
|
|
55,328 |
| Calibration 2 |
|
|
55,481 |
| Calibration 3 |
|
|
55,511 |
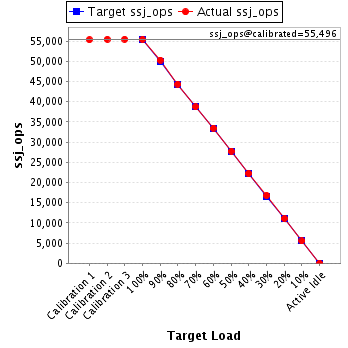
| ssj_ops@calibrated=55,496 |
| 100% |
99.9% |
55,496 |
55,464 |
| 90% |
90.7% |
49,946 |
50,338 |
| 80% |
80.0% |
44,397 |
44,370 |
| 70% |
69.8% |
38,847 |
38,724 |
| 60% |
60.4% |
33,298 |
33,496 |
| 50% |
50.0% |
27,748 |
27,765 |
| 40% |
40.1% |
22,198 |
22,249 |
| 30% |
30.3% |
16,649 |
16,804 |
| 20% |
20.0% |
11,099 |
11,089 |
| 10% |
9.9% |
5,550 |
5,521 |
| Active Idle |
|
0 |
0 |
JVM 'R140b-4.008' Scores:
| Target Load |
Actual Load |
ssj_ops |
| Target |
Actual |
| Calibration 1 |
|
|
58,407 |
| Calibration 2 |
|
|
58,887 |
| Calibration 3 |
|
|
59,330 |
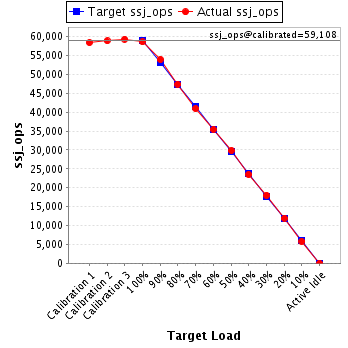
| ssj_ops@calibrated=59,108 |
| 100% |
99.1% |
59,108 |
58,584 |
| 90% |
91.3% |
53,198 |
53,992 |
| 80% |
80.2% |
47,287 |
47,398 |
| 70% |
69.3% |
41,376 |
40,944 |
| 60% |
59.9% |
35,465 |
35,433 |
| 50% |
50.5% |
29,554 |
29,869 |
| 40% |
39.7% |
23,643 |
23,491 |
| 30% |
30.5% |
17,733 |
18,000 |
| 20% |
20.2% |
11,822 |
11,950 |
| 10% |
9.8% |
5,911 |
5,780 |
| Active Idle |
|
0 |
0 |
JVM 'R140b-4.009' Scores:
| Target Load |
Actual Load |
ssj_ops |
| Target |
Actual |
| Calibration 1 |
|
|
57,649 |
| Calibration 2 |
|
|
58,620 |
| Calibration 3 |
|
|
58,818 |
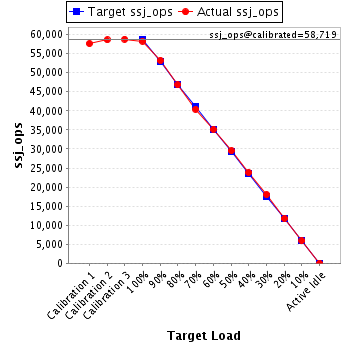
| ssj_ops@calibrated=58,719 |
| 100% |
99.3% |
58,719 |
58,293 |
| 90% |
90.7% |
52,847 |
53,243 |
| 80% |
79.8% |
46,975 |
46,836 |
| 70% |
68.9% |
41,103 |
40,439 |
| 60% |
59.9% |
35,231 |
35,166 |
| 50% |
50.3% |
29,360 |
29,545 |
| 40% |
40.6% |
23,488 |
23,815 |
| 30% |
30.7% |
17,616 |
18,020 |
| 20% |
20.0% |
11,744 |
11,754 |
| 10% |
10.1% |
5,872 |
5,912 |
| Active Idle |
|
0 |
0 |
JVM 'R140b-4.010' Scores:
| Target Load |
Actual Load |
ssj_ops |
| Target |
Actual |
| Calibration 1 |
|
|
55,726 |
| Calibration 2 |
|
|
55,668 |
| Calibration 3 |
|
|
55,873 |
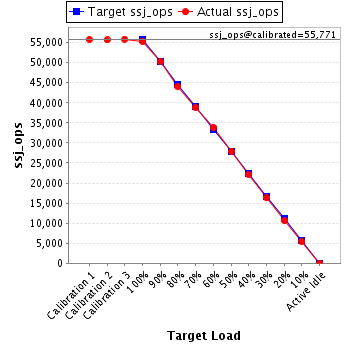
| ssj_ops@calibrated=55,771 |
| 100% |
99.2% |
55,771 |
55,327 |
| 90% |
90.2% |
50,194 |
50,302 |
| 80% |
79.1% |
44,616 |
44,112 |
| 70% |
69.7% |
39,039 |
38,870 |
| 60% |
60.7% |
33,462 |
33,864 |
| 50% |
50.0% |
27,885 |
27,874 |
| 40% |
39.7% |
22,308 |
22,129 |
| 30% |
29.2% |
16,731 |
16,277 |
| 20% |
19.0% |
11,154 |
10,601 |
| 10% |
9.8% |
5,577 |
5,487 |
| Active Idle |
|
0 |
0 |
JVM 'R140b-4.011' Scores:
| Target Load |
Actual Load |
ssj_ops |
| Target |
Actual |
| Calibration 1 |
|
|
58,447 |
| Calibration 2 |
|
|
59,173 |
| Calibration 3 |
|
|
58,983 |
| ssj_ops@calibrated=59,078 |
| 100% |
99.1% |
59,078 |
58,518 |
| 90% |
90.4% |
53,170 |
53,379 |
| 80% |
79.3% |
47,262 |
46,878 |
| 70% |
69.6% |
41,355 |
41,103 |
| 60% |
60.8% |
35,447 |
35,946 |
| 50% |
49.5% |
29,539 |
29,253 |
| 40% |
41.0% |
23,631 |
24,199 |
| 30% |
30.1% |
17,723 |
17,753 |
| 20% |
19.6% |
11,816 |
11,596 |
| 10% |
10.6% |
5,908 |
6,262 |
| Active Idle |
|
0 |
0 |
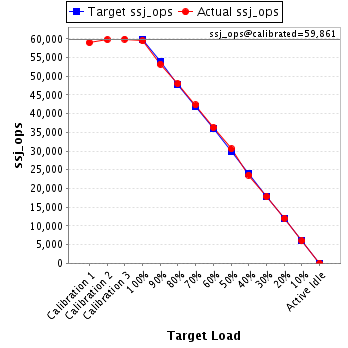
JVM 'R140b-4.012' Scores:
| Target Load |
Actual Load |
ssj_ops |
| Target |
Actual |
| Calibration 1 |
|
|
58,953 |
| Calibration 2 |
|
|
59,798 |
| Calibration 3 |
|
|
59,924 |
| ssj_ops@calibrated=59,861 |
| 100% |
99.3% |
59,861 |
59,454 |
| 90% |
88.9% |
53,875 |
53,240 |
| 80% |
80.2% |
47,889 |
48,006 |
| 70% |
70.7% |
41,903 |
42,320 |
| 60% |
60.6% |
35,917 |
36,270 |
| 50% |
51.1% |
29,930 |
30,592 |
| 40% |
39.4% |
23,944 |
23,591 |
| 30% |
29.7% |
17,958 |
17,800 |
| 20% |
20.1% |
11,972 |
12,037 |
| 10% |
10.0% |
5,986 |
5,981 |
| Active Idle |
|
0 |
0 |
JVM 'R140b-4.013' Scores:
| Target Load |
Actual Load |
ssj_ops |
| Target |
Actual |
| Calibration 1 |
|
|
58,387 |
| Calibration 2 |
|
|
58,905 |
| Calibration 3 |
|
|
58,929 |
| ssj_ops@calibrated=58,917 |
| 100% |
99.5% |
58,917 |
58,617 |
| 90% |
89.9% |
53,025 |
52,975 |
| 80% |
80.5% |
47,133 |
47,436 |
| 70% |
70.4% |
41,242 |
41,466 |
| 60% |
60.7% |
35,350 |
35,762 |
| 50% |
49.7% |
29,458 |
29,264 |
| 40% |
40.0% |
23,567 |
23,566 |
| 30% |
29.7% |
17,675 |
17,492 |
| 20% |
19.8% |
11,783 |
11,642 |
| 10% |
10.0% |
5,892 |
5,879 |
| Active Idle |
|
0 |
0 |
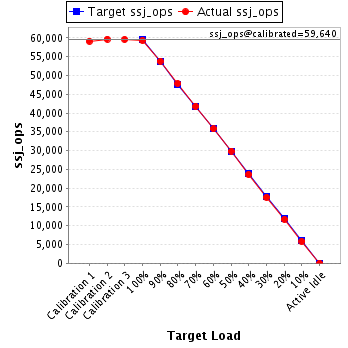
JVM 'R140b-4.014' Scores:
| Target Load |
Actual Load |
ssj_ops |
| Target |
Actual |
| Calibration 1 |
|
|
59,156 |
| Calibration 2 |
|
|
59,669 |
| Calibration 3 |
|
|
59,610 |
| ssj_ops@calibrated=59,640 |
| 100% |
99.5% |
59,640 |
59,340 |
| 90% |
90.2% |
53,676 |
53,824 |
| 80% |
80.3% |
47,712 |
47,862 |
| 70% |
70.2% |
41,748 |
41,854 |
| 60% |
60.0% |
35,784 |
35,785 |
| 50% |
50.1% |
29,820 |
29,874 |
| 40% |
39.6% |
23,856 |
23,633 |
| 30% |
29.5% |
17,892 |
17,579 |
| 20% |
19.6% |
11,928 |
11,700 |
| 10% |
9.8% |
5,964 |
5,837 |
| Active Idle |
|
0 |
0 |
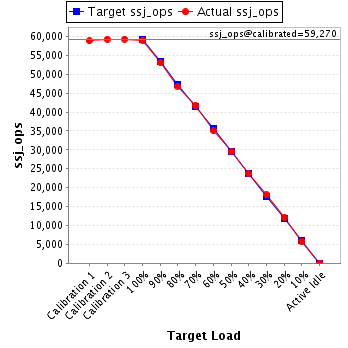
JVM 'R140b-4.015' Scores:
| Target Load |
Actual Load |
ssj_ops |
| Target |
Actual |
| Calibration 1 |
|
|
58,823 |
| Calibration 2 |
|
|
59,262 |
| Calibration 3 |
|
|
59,278 |
| ssj_ops@calibrated=59,270 |
| 100% |
99.6% |
59,270 |
59,010 |
| 90% |
89.6% |
53,343 |
53,104 |
| 80% |
79.1% |
47,416 |
46,864 |
| 70% |
70.4% |
41,489 |
41,746 |
| 60% |
59.1% |
35,562 |
35,055 |
| 50% |
49.8% |
29,635 |
29,498 |
| 40% |
39.9% |
23,708 |
23,673 |
| 30% |
30.5% |
17,781 |
18,061 |
| 20% |
20.2% |
11,854 |
11,974 |
| 10% |
9.7% |
5,927 |
5,748 |
| Active Idle |
|
0 |
0 |
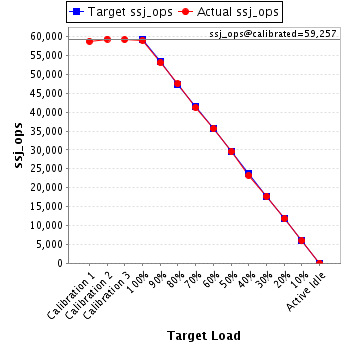
JVM 'R140b-4.016' Scores:
| Target Load |
Actual Load |
ssj_ops |
| Target |
Actual |
| Calibration 1 |
|
|
58,751 |
| Calibration 2 |
|
|
59,315 |
| Calibration 3 |
|
|
59,200 |
| ssj_ops@calibrated=59,257 |
| 100% |
99.6% |
59,257 |
59,004 |
| 90% |
89.6% |
53,331 |
53,094 |
| 80% |
80.2% |
47,406 |
47,499 |
| 70% |
69.6% |
41,480 |
41,236 |
| 60% |
60.1% |
35,554 |
35,595 |
| 50% |
49.9% |
29,629 |
29,554 |
| 40% |
39.3% |
23,703 |
23,264 |
| 30% |
29.9% |
17,777 |
17,711 |
| 20% |
19.9% |
11,851 |
11,810 |
| 10% |
10.1% |
5,926 |
5,968 |
| Active Idle |
|
0 |
0 |
JVM 'R140b-4.017' Scores:
| Target Load |
Actual Load |
ssj_ops |
| Target |
Actual |
| Calibration 1 |
|
|
58,582 |
| Calibration 2 |
|
|
59,327 |
| Calibration 3 |
|
|
59,523 |
| ssj_ops@calibrated=59,425 |
| 100% |
99.8% |
59,425 |
59,318 |
| 90% |
91.2% |
53,483 |
54,192 |
| 80% |
80.1% |
47,540 |
47,583 |
| 70% |
69.4% |
41,598 |
41,255 |
| 60% |
60.6% |
35,655 |
35,999 |
| 50% |
50.2% |
29,713 |
29,852 |
| 40% |
39.8% |
23,770 |
23,658 |
| 30% |
28.8% |
17,828 |
17,124 |
| 20% |
19.9% |
11,885 |
11,840 |
| 10% |
10.1% |
5,943 |
5,979 |
| Active Idle |
|
0 |
0 |
JVM 'R140b-4.018' Scores:
| Target Load |
Actual Load |
ssj_ops |
| Target |
Actual |
| Calibration 1 |
|
|
58,480 |
| Calibration 2 |
|
|
59,153 |
| Calibration 3 |
|
|
59,127 |
| ssj_ops@calibrated=59,140 |
| 100% |
99.6% |
59,140 |
58,911 |
| 90% |
90.9% |
53,226 |
53,778 |
| 80% |
78.9% |
47,312 |
46,685 |
| 70% |
71.9% |
41,398 |
42,497 |
| 60% |
59.6% |
35,484 |
35,249 |
| 50% |
50.2% |
29,570 |
29,705 |
| 40% |
39.5% |
23,656 |
23,354 |
| 30% |
30.2% |
17,742 |
17,862 |
| 20% |
20.2% |
11,828 |
11,958 |
| 10% |
9.8% |
5,914 |
5,767 |
| Active Idle |
|
0 |
0 |
JVM 'R140b-4.019' Scores:
| Target Load |
Actual Load |
ssj_ops |
| Target |
Actual |
| Calibration 1 |
|
|
58,538 |
| Calibration 2 |
|
|
58,880 |
| Calibration 3 |
|
|
58,746 |
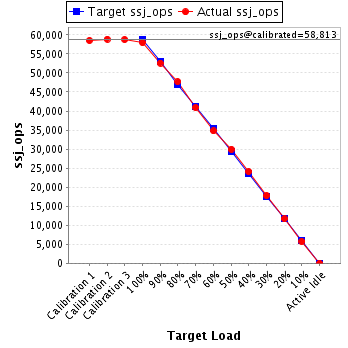
| ssj_ops@calibrated=58,813 |
| 100% |
98.5% |
58,813 |
57,954 |
| 90% |
89.5% |
52,931 |
52,612 |
| 80% |
81.1% |
47,050 |
47,677 |
| 70% |
69.5% |
41,169 |
40,903 |
| 60% |
59.1% |
35,288 |
34,762 |
| 50% |
50.9% |
29,406 |
29,959 |
| 40% |
40.9% |
23,525 |
24,071 |
| 30% |
30.2% |
17,644 |
17,764 |
| 20% |
19.8% |
11,763 |
11,668 |
| 10% |
9.7% |
5,881 |
5,727 |
| Active Idle |
|
0 |
0 |
JVM 'R140b-4.020' Scores:
| Target Load |
Actual Load |
ssj_ops |
| Target |
Actual |
| Calibration 1 |
|
|
58,268 |
| Calibration 2 |
|
|
59,110 |
| Calibration 3 |
|
|
58,926 |
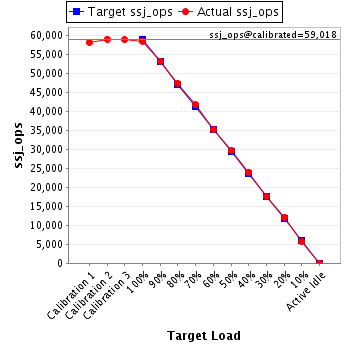
| ssj_ops@calibrated=59,018 |
| 100% |
99.3% |
59,018 |
58,593 |
| 90% |
90.3% |
53,116 |
53,299 |
| 80% |
80.5% |
47,214 |
47,522 |
| 70% |
70.8% |
41,312 |
41,808 |
| 60% |
59.6% |
35,411 |
35,173 |
| 50% |
50.2% |
29,509 |
29,632 |
| 40% |
40.7% |
23,607 |
24,012 |
| 30% |
29.9% |
17,705 |
17,621 |
| 20% |
20.7% |
11,804 |
12,190 |
| 10% |
9.7% |
5,902 |
5,710 |
| Active Idle |
|
0 |
0 |
JVM 'R140b-4.021' Scores:
| Target Load |
Actual Load |
ssj_ops |
| Target |
Actual |
| Calibration 1 |
|
|
58,236 |
| Calibration 2 |
|
|
58,663 |
| Calibration 3 |
|
|
58,360 |
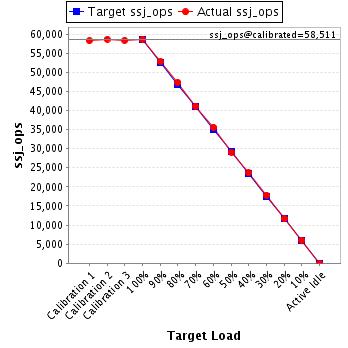
| ssj_ops@calibrated=58,511 |
| 100% |
100.3% |
58,511 |
58,668 |
| 90% |
90.3% |
52,660 |
52,825 |
| 80% |
80.9% |
46,809 |
47,365 |
| 70% |
70.3% |
40,958 |
41,157 |
| 60% |
60.9% |
35,107 |
35,624 |
| 50% |
49.7% |
29,256 |
29,102 |
| 40% |
40.4% |
23,405 |
23,633 |
| 30% |
30.5% |
17,553 |
17,841 |
| 20% |
19.9% |
11,702 |
11,662 |
| 10% |
10.2% |
5,851 |
5,991 |
| Active Idle |
|
0 |
0 |
JVM 'R140b-4.022' Scores:
| Target Load |
Actual Load |
ssj_ops |
| Target |
Actual |
| Calibration 1 |
|
|
55,422 |
| Calibration 2 |
|
|
56,616 |
| Calibration 3 |
|
|
56,778 |
| ssj_ops@calibrated=56,697 |
| 100% |
99.3% |
56,697 |
56,278 |
| 90% |
89.8% |
51,027 |
50,936 |
| 80% |
79.0% |
45,358 |
44,794 |
| 70% |
70.7% |
39,688 |
40,105 |
| 60% |
60.1% |
34,018 |
34,055 |
| 50% |
50.5% |
28,348 |
28,630 |
| 40% |
39.7% |
22,679 |
22,483 |
| 30% |
30.1% |
17,009 |
17,060 |
| 20% |
20.8% |
11,339 |
11,790 |
| 10% |
10.2% |
5,670 |
5,771 |
| Active Idle |
|
0 |
0 |
JVM 'R140b-4.023' Scores:
| Target Load |
Actual Load |
ssj_ops |
| Target |
Actual |
| Calibration 1 |
|
|
56,206 |
| Calibration 2 |
|
|
56,641 |
| Calibration 3 |
|
|
56,505 |
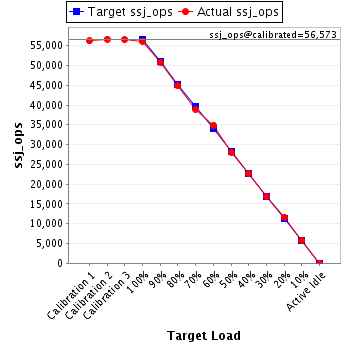
| ssj_ops@calibrated=56,573 |
| 100% |
99.1% |
56,573 |
56,073 |
| 90% |
89.7% |
50,916 |
50,752 |
| 80% |
79.4% |
45,258 |
44,906 |
| 70% |
68.9% |
39,601 |
38,970 |
| 60% |
61.7% |
33,944 |
34,918 |
| 50% |
49.5% |
28,286 |
28,003 |
| 40% |
40.1% |
22,629 |
22,708 |
| 30% |
29.8% |
16,972 |
16,833 |
| 20% |
20.6% |
11,315 |
11,664 |
| 10% |
10.3% |
5,657 |
5,831 |
| Active Idle |
|
0 |
0 |
JVM 'R140b-4.024' Scores:
| Target Load |
Actual Load |
ssj_ops |
| Target |
Actual |
| Calibration 1 |
|
|
58,446 |
| Calibration 2 |
|
|
58,805 |
| Calibration 3 |
|
|
58,856 |
| ssj_ops@calibrated=58,831 |
| 100% |
99.1% |
58,831 |
58,330 |
| 90% |
88.5% |
52,948 |
52,041 |
| 80% |
79.8% |
47,065 |
46,927 |
| 70% |
70.0% |
41,182 |
41,206 |
| 60% |
60.2% |
35,298 |
35,443 |
| 50% |
49.6% |
29,415 |
29,165 |
| 40% |
40.8% |
23,532 |
23,987 |
| 30% |
29.5% |
17,649 |
17,369 |
| 20% |
19.8% |
11,766 |
11,675 |
| 10% |
9.8% |
5,883 |
5,744 |
| Active Idle |
|
0 |
0 |
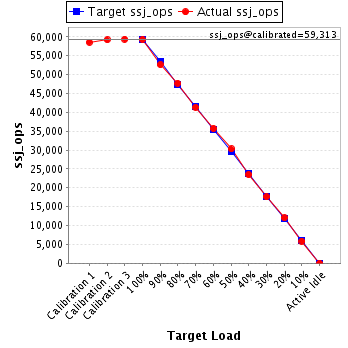
JVM 'R140b-4.025' Scores:
| Target Load |
Actual Load |
ssj_ops |
| Target |
Actual |
| Calibration 1 |
|
|
58,617 |
| Calibration 2 |
|
|
59,221 |
| Calibration 3 |
|
|
59,404 |
| ssj_ops@calibrated=59,313 |
| 100% |
100.0% |
59,313 |
59,330 |
| 90% |
88.7% |
53,381 |
52,623 |
| 80% |
80.5% |
47,450 |
47,731 |
| 70% |
69.7% |
41,519 |
41,354 |
| 60% |
60.2% |
35,588 |
35,716 |
| 50% |
51.1% |
29,656 |
30,300 |
| 40% |
39.6% |
23,725 |
23,488 |
| 30% |
29.7% |
17,794 |
17,610 |
| 20% |
20.3% |
11,863 |
12,043 |
| 10% |
9.9% |
5,931 |
5,854 |
| Active Idle |
|
0 |
0 |
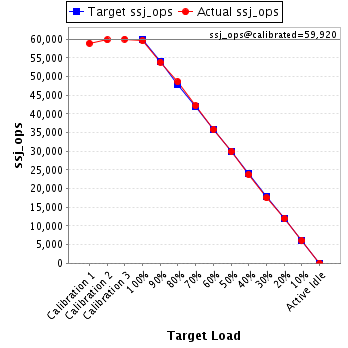
JVM 'R140b-4.026' Scores:
| Target Load |
Actual Load |
ssj_ops |
| Target |
Actual |
| Calibration 1 |
|
|
58,926 |
| Calibration 2 |
|
|
59,829 |
| Calibration 3 |
|
|
60,010 |
| ssj_ops@calibrated=59,920 |
| 100% |
99.4% |
59,920 |
59,581 |
| 90% |
89.8% |
53,928 |
53,827 |
| 80% |
81.1% |
47,936 |
48,589 |
| 70% |
70.4% |
41,944 |
42,185 |
| 60% |
59.7% |
35,952 |
35,791 |
| 50% |
50.0% |
29,960 |
29,936 |
| 40% |
39.6% |
23,968 |
23,731 |
| 30% |
29.2% |
17,976 |
17,511 |
| 20% |
20.0% |
11,984 |
11,964 |
| 10% |
10.1% |
5,992 |
6,073 |
| Active Idle |
|
0 |
0 |
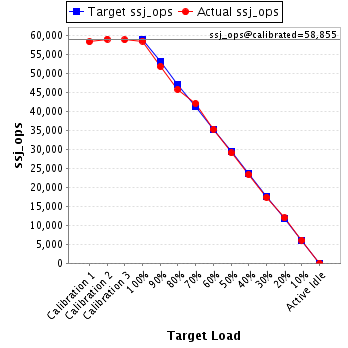
JVM 'R140b-4.027' Scores:
| Target Load |
Actual Load |
ssj_ops |
| Target |
Actual |
| Calibration 1 |
|
|
58,225 |
| Calibration 2 |
|
|
58,944 |
| Calibration 3 |
|
|
58,765 |
| ssj_ops@calibrated=58,855 |
| 100% |
99.3% |
58,855 |
58,462 |
| 90% |
88.0% |
52,969 |
51,794 |
| 80% |
77.7% |
47,084 |
45,716 |
| 70% |
71.4% |
41,198 |
42,026 |
| 60% |
59.9% |
35,313 |
35,260 |
| 50% |
49.3% |
29,427 |
29,031 |
| 40% |
39.6% |
23,542 |
23,306 |
| 30% |
29.5% |
17,656 |
17,362 |
| 20% |
20.3% |
11,771 |
11,927 |
| 10% |
10.3% |
5,885 |
6,062 |
| Active Idle |
|
0 |
0 |
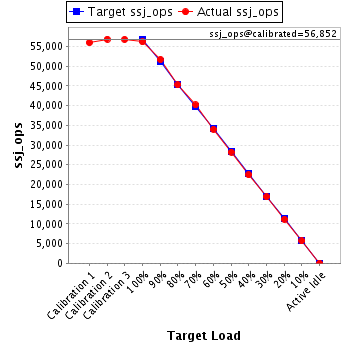
JVM 'R140b-4.028' Scores:
| Target Load |
Actual Load |
ssj_ops |
| Target |
Actual |
| Calibration 1 |
|
|
55,977 |
| Calibration 2 |
|
|
56,876 |
| Calibration 3 |
|
|
56,829 |
| ssj_ops@calibrated=56,852 |
| 100% |
98.8% |
56,852 |
56,171 |
| 90% |
91.0% |
51,167 |
51,718 |
| 80% |
79.6% |
45,482 |
45,279 |
| 70% |
70.7% |
39,797 |
40,183 |
| 60% |
59.8% |
34,111 |
33,998 |
| 50% |
49.7% |
28,426 |
28,237 |
| 40% |
39.4% |
22,741 |
22,425 |
| 30% |
29.6% |
17,056 |
16,849 |
| 20% |
19.7% |
11,370 |
11,183 |
| 10% |
10.0% |
5,685 |
5,687 |
| Active Idle |
|
0 |
0 |
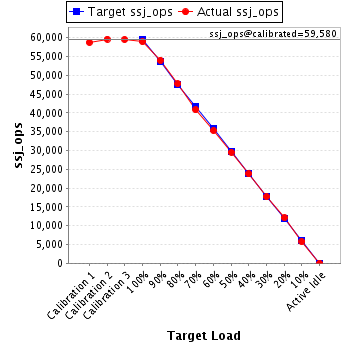
JVM 'R140b-4.029' Scores:
| Target Load |
Actual Load |
ssj_ops |
| Target |
Actual |
| Calibration 1 |
|
|
58,778 |
| Calibration 2 |
|
|
59,630 |
| Calibration 3 |
|
|
59,529 |
| ssj_ops@calibrated=59,580 |
| 100% |
98.9% |
59,580 |
58,951 |
| 90% |
90.7% |
53,622 |
54,031 |
| 80% |
80.2% |
47,664 |
47,774 |
| 70% |
68.5% |
41,706 |
40,828 |
| 60% |
59.3% |
35,748 |
35,342 |
| 50% |
49.6% |
29,790 |
29,523 |
| 40% |
39.9% |
23,832 |
23,788 |
| 30% |
29.7% |
17,874 |
17,706 |
| 20% |
20.3% |
11,916 |
12,108 |
| 10% |
9.7% |
5,958 |
5,760 |
| Active Idle |
|
0 |
0 |
JVM 'R140b-4.030' Scores:
| Target Load |
Actual Load |
ssj_ops |
| Target |
Actual |
| Calibration 1 |
|
|
58,624 |
| Calibration 2 |
|
|
59,175 |
| Calibration 3 |
|
|
59,266 |
| ssj_ops@calibrated=59,221 |
| 100% |
98.9% |
59,221 |
58,581 |
| 90% |
91.9% |
53,299 |
54,428 |
| 80% |
80.5% |
47,377 |
47,646 |
| 70% |
71.2% |
41,455 |
42,168 |
| 60% |
60.4% |
35,533 |
35,798 |
| 50% |
49.4% |
29,610 |
29,233 |
| 40% |
39.3% |
23,688 |
23,273 |
| 30% |
30.0% |
17,766 |
17,755 |
| 20% |
19.9% |
11,844 |
11,761 |
| 10% |
10.3% |
5,922 |
6,128 |
| Active Idle |
|
0 |
0 |
JVM 'R140b-4.031' Scores:
| Target Load |
Actual Load |
ssj_ops |
| Target |
Actual |
| Calibration 1 |
|
|
58,747 |
| Calibration 2 |
|
|
58,878 |
| Calibration 3 |
|
|
58,961 |
| ssj_ops@calibrated=58,919 |
| 100% |
99.7% |
58,919 |
58,756 |
| 90% |
89.1% |
53,028 |
52,526 |
| 80% |
80.8% |
47,136 |
47,632 |
| 70% |
69.6% |
41,244 |
41,002 |
| 60% |
60.5% |
35,352 |
35,653 |
| 50% |
51.0% |
29,460 |
30,031 |
| 40% |
39.7% |
23,568 |
23,416 |
| 30% |
29.4% |
17,676 |
17,325 |
| 20% |
20.1% |
11,784 |
11,858 |
| 10% |
10.2% |
5,892 |
6,011 |
| Active Idle |
|
0 |
0 |
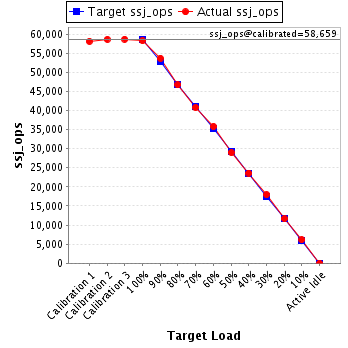
JVM 'R140b-4.032' Scores:
| Target Load |
Actual Load |
ssj_ops |
| Target |
Actual |
| Calibration 1 |
|
|
58,143 |
| Calibration 2 |
|
|
58,635 |
| Calibration 3 |
|
|
58,683 |
| ssj_ops@calibrated=58,659 |
| 100% |
99.3% |
58,659 |
58,265 |
| 90% |
91.6% |
52,793 |
53,727 |
| 80% |
79.6% |
46,927 |
46,698 |
| 70% |
69.6% |
41,061 |
40,798 |
| 60% |
61.1% |
35,195 |
35,839 |
| 50% |
49.4% |
29,329 |
28,969 |
| 40% |
40.3% |
23,464 |
23,632 |
| 30% |
30.6% |
17,598 |
17,941 |
| 20% |
19.9% |
11,732 |
11,648 |
| 10% |
10.5% |
5,866 |
6,185 |
| Active Idle |
|
0 |
0 |