SPECpower_ssj2008
Host 'WIN-7R29E6346S5' Performance Report
Copyright © 2007-2011 Standard Performance Evaluation Corporation
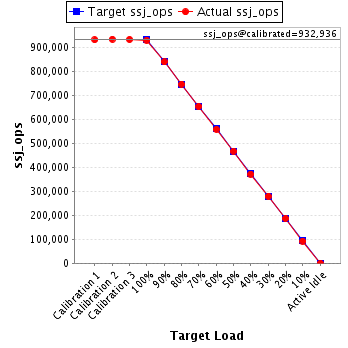
| IBM Corporation System x3630 M3 | ssj_ops@100% = 928,920 ssj_ops@100% per JVM = 154,820 |
||||
| Test Sponsor: | IBM Corporation | SPEC License #: | 11 | Test Method: | Single Node |
| Tested By: | IBM Corporation | Test Location: | NanKang, Taipei, Taiwan | Test Date: | Jan 31, 2011 |
| Hardware Availability: | Mar-2011 | Software Availability: | Jun-2009 | Publication: | Mar 2, 2011 |
| System Source: | Single Supplier | System Designation: | Server | Power Provisioning: | Line-powered |
| Target Load | Actual Load | ssj_ops | |
|---|---|---|---|
| Target | Actual | ||
| Calibration 1 | 930,515 | ||
| Calibration 2 | 933,688 | ||
| Calibration 3 | 932,184 | ||
| ssj_ops@calibrated=932,936 | |||
| 100% | 99.6% | 932,936 | 928,920 |
| 90% | 89.9% | 839,642 | 838,662 |
| 80% | 80.0% | 746,349 | 746,734 |
| 70% | 70.0% | 653,055 | 653,095 |
| 60% | 59.9% | 559,761 | 558,436 |
| 50% | 50.1% | 466,468 | 467,721 |
| 40% | 39.8% | 373,174 | 371,745 |
| 30% | 29.9% | 279,881 | 279,067 |
| 20% | 20.0% | 186,587 | 186,825 |
| 10% | 9.9% | 93,294 | 92,658 |
| Active Idle | 0 | 0 | |
| Set Identifier: | sut |
| Set Description: | System Under Test |
| # of Identical Nodes: | 1 |
| Comment: | None |
| Hardware | |
|---|---|
| Hardware Vendor: | IBM Corporation |
| Model: | System x3630 M3 |
| Form Factor: | 2U |
| CPU Name: | Intel Xeon X5675 |
| CPU Characteristics: | 6-Core, 3.07GHz, 12MB L3 Cache |
| CPU Frequency (MHz): | 3067 |
| CPU(s) Enabled: | 12 cores, 2 chips, 6 cores/chip |
| Hardware Threads: | 24 (2 / core) |
| CPU(s) Orderable: | 1,2 chips |
| Primary Cache: | 32 KB I + 32 KB D on chip per core |
| Secondary Cache: | 256 KB I+D on chip per core |
| Tertiary Cache: | 12 MB I+D on chip per chip |
| Other Cache: | None |
| Memory Amount (GB): | 12 |
| # and size of DIMM: | 6 x 2048 MB |
| Memory Details: | 2GB 2Rx8 PC3L-10600R; slots 3, 6, 8, 11, 14 and 16 populated |
| Power Supply Quantity and Rating (W): | 1 x 675 |
| Power Supply Details: | IBM P/N:39Y7216 |
| Disk Drive: | 1 x 160GB 7200 SATA 2.5" SFF Slim-HS HDD (IBM P/N:42D0747) |
| Disk Controller: | ServeRAID M1015 SAS/SATA Controller (IBM P/N:46M0831) |
| # and type of Network Interface Cards (NICs) Installed: | 2 x Integrated Intel 82575EB Gigabit Ethernet Controller |
| NICs Enabled in Firmware / OS / Connected: | 1/1/1 |
| Network Speed (Mbit): | 1000 |
| Keyboard: | KVM |
| Mouse: | KVM |
| Monitor: | KVM |
| Optical Drives: | Yes |
| Other Hardware: | None |
| Software | |
|---|---|
| Power Management: | Enabled (see SUT Notes) |
| Operating System (OS): | Microsoft Windows Server 2008 R2 Enterprise Edition |
| OS Version: | R2 |
| Filesystem: | NTFS |
| JVM Vendor: | IBM Corporation |
| JVM Version: | IBM J9 VM (build pwa6460sr5-20090529_04(SR5)) |
| JVM Command-line Options: | -Xaggressive -Xcompressedrefs -Xgcpolicy:gencon -Xmn1100m -Xms1500m -Xmx1500m -XlockReservation -Xnoloa -XtlhPrefetch -Xlp |
| JVM Affinity: | start /affinity [0F,F0,F00,F000,F0000,F00000] |
| JVM Instances: | 6 |
| JVM Initial Heap (MB): | 1500 |
| JVM Maximum Heap (MB): | 1500 |
| JVM Address Bits: | 64 |
| Boot Firmware Version: | HSE117WUS |
| Management Firmware Version: | YUOO91I |
| Workload Version: | SSJ 1.2.6 |
| Director Location: | Controller |
| Other Software: | None |
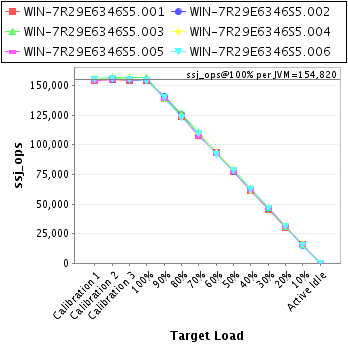
| JVM Instance | ssj_ops@100% |
|---|---|
| WIN-7R29E6346S5.001 | 154,570 |
| WIN-7R29E6346S5.002 | 154,604 |
| WIN-7R29E6346S5.003 | 156,401 |
| WIN-7R29E6346S5.004 | 154,478 |
| WIN-7R29E6346S5.005 | 154,941 |
| WIN-7R29E6346S5.006 | 153,926 |
| ssj_ops@100% | 928,920 |
| ssj_ops@100% per JVM | 154,820 |
| Target Load | Actual Load | ssj_ops | |
|---|---|---|---|
| Target | Actual | ||
| Calibration 1 | 154,407 | ||
| Calibration 2 | 155,104 | ||
| Calibration 3 | 154,255 | ||
| ssj_ops@calibrated=154,680 | |||
| 100% | 99.9% | 154,680 | 154,570 |
| 90% | 90.5% | 139,212 | 139,914 |
| 80% | 79.9% | 123,744 | 123,521 |
| 70% | 69.7% | 108,276 | 107,763 |
| 60% | 60.5% | 92,808 | 93,588 |
| 50% | 49.8% | 77,340 | 77,077 |
| 40% | 39.7% | 61,872 | 61,465 |
| 30% | 29.4% | 46,404 | 45,472 |
| 20% | 19.6% | 30,936 | 30,260 |
| 10% | 10.0% | 15,468 | 15,460 |
| Active Idle | 0 | 0 | |
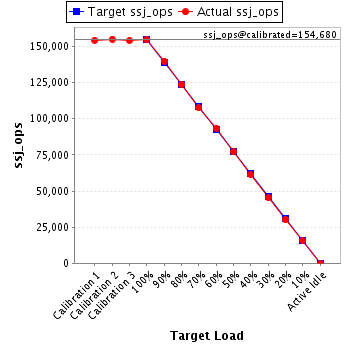
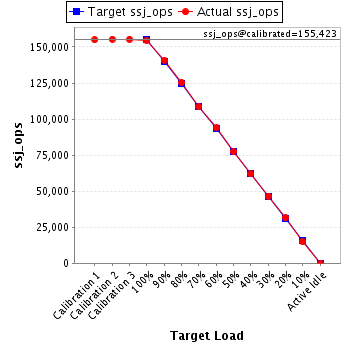
| Target Load | Actual Load | ssj_ops | |
|---|---|---|---|
| Target | Actual | ||
| Calibration 1 | 154,912 | ||
| Calibration 2 | 155,428 | ||
| Calibration 3 | 155,419 | ||
| ssj_ops@calibrated=155,423 | |||
| 100% | 99.5% | 155,423 | 154,604 |
| 90% | 90.6% | 139,881 | 140,804 |
| 80% | 80.7% | 124,339 | 125,478 |
| 70% | 69.8% | 108,796 | 108,485 |
| 60% | 60.4% | 93,254 | 93,822 |
| 50% | 49.8% | 77,712 | 77,454 |
| 40% | 39.8% | 62,169 | 61,928 |
| 30% | 30.0% | 46,627 | 46,632 |
| 20% | 20.2% | 31,085 | 31,423 |
| 10% | 9.7% | 15,542 | 15,062 |
| Active Idle | 0 | 0 | |
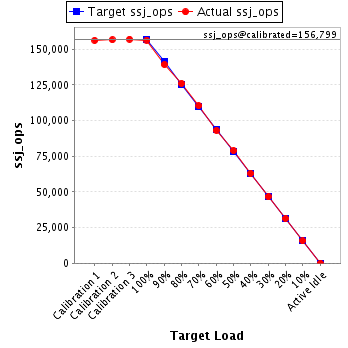
| Target Load | Actual Load | ssj_ops | |
|---|---|---|---|
| Target | Actual | ||
| Calibration 1 | 156,222 | ||
| Calibration 2 | 156,530 | ||
| Calibration 3 | 157,067 | ||
| ssj_ops@calibrated=156,799 | |||
| 100% | 99.7% | 156,799 | 156,401 |
| 90% | 88.9% | 141,119 | 139,318 |
| 80% | 80.4% | 125,439 | 126,117 |
| 70% | 70.4% | 109,759 | 110,398 |
| 60% | 59.4% | 94,079 | 93,132 |
| 50% | 50.3% | 78,399 | 78,915 |
| 40% | 40.2% | 62,720 | 63,040 |
| 30% | 29.8% | 47,040 | 46,654 |
| 20% | 20.0% | 31,360 | 31,404 |
| 10% | 10.0% | 15,680 | 15,729 |
| Active Idle | 0 | 0 | |
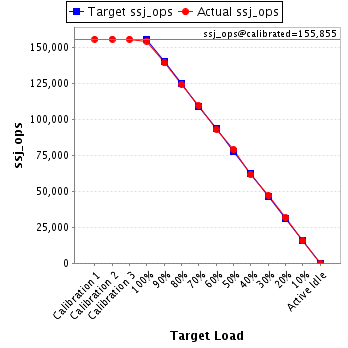
| Target Load | Actual Load | ssj_ops | |
|---|---|---|---|
| Target | Actual | ||
| Calibration 1 | 155,816 | ||
| Calibration 2 | 155,861 | ||
| Calibration 3 | 155,850 | ||
| ssj_ops@calibrated=155,855 | |||
| 100% | 99.1% | 155,855 | 154,478 |
| 90% | 89.4% | 140,270 | 139,338 |
| 80% | 79.7% | 124,684 | 124,292 |
| 70% | 70.3% | 109,099 | 109,494 |
| 60% | 59.9% | 93,513 | 93,355 |
| 50% | 50.7% | 77,928 | 79,014 |
| 40% | 39.6% | 62,342 | 61,727 |
| 30% | 30.2% | 46,757 | 47,081 |
| 20% | 20.2% | 31,171 | 31,515 |
| 10% | 10.0% | 15,586 | 15,586 |
| Active Idle | 0 | 0 | |
| Target Load | Actual Load | ssj_ops | |
|---|---|---|---|
| Target | Actual | ||
| Calibration 1 | 154,201 | ||
| Calibration 2 | 155,055 | ||
| Calibration 3 | 154,720 | ||
| ssj_ops@calibrated=154,888 | |||
| 100% | 100.0% | 154,888 | 154,941 |
| 90% | 89.7% | 139,399 | 138,992 |
| 80% | 80.1% | 123,910 | 124,027 |
| 70% | 69.5% | 108,421 | 107,633 |
| 60% | 59.7% | 92,933 | 92,494 |
| 50% | 49.8% | 77,444 | 77,071 |
| 40% | 39.8% | 61,955 | 61,640 |
| 30% | 30.2% | 46,466 | 46,706 |
| 20% | 20.0% | 30,978 | 30,937 |
| 10% | 10.0% | 15,489 | 15,446 |
| Active Idle | 0 | 0 | |

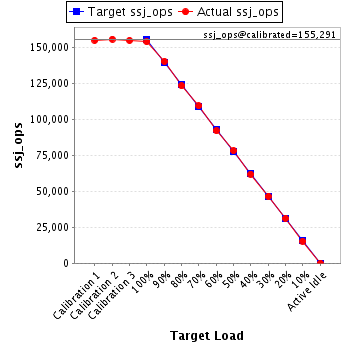
| Target Load | Actual Load | ssj_ops | |
|---|---|---|---|
| Target | Actual | ||
| Calibration 1 | 154,956 | ||
| Calibration 2 | 155,710 | ||
| Calibration 3 | 154,873 | ||
| ssj_ops@calibrated=155,291 | |||
| 100% | 99.1% | 155,291 | 153,926 |
| 90% | 90.3% | 139,762 | 140,296 |
| 80% | 79.4% | 124,233 | 123,298 |
| 70% | 70.4% | 108,704 | 109,322 |
| 60% | 59.3% | 93,175 | 92,045 |
| 50% | 50.4% | 77,646 | 78,190 |
| 40% | 39.9% | 62,117 | 61,945 |
| 30% | 30.0% | 46,587 | 46,523 |
| 20% | 20.1% | 31,058 | 31,285 |
| 10% | 9.9% | 15,529 | 15,375 |
| Active Idle | 0 | 0 | |