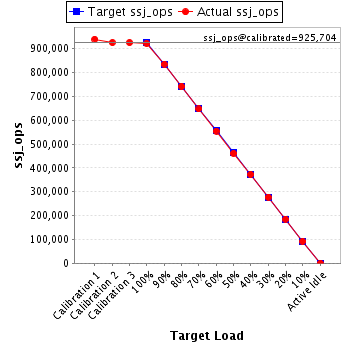
SPECpower_ssj2008
Aggregate Performance Report
Copyright © 2007-2011 Standard Performance Evaluation Corporation
| Dell Inc. PowerEdge M610 | ssj_ops@100% = 14,760,777 ssj_ops@100% per Host = 922,549 ssj_ops@100% per JVM = 461,274 |
||||
| Test Sponsor: | Dell Inc. | SPEC License #: | 55 | Test Method: | Multi Node |
| Tested By: | Dell Inc. | Test Location: | Round Rock, TX, USA | Test Date: | Sep 26, 2011 |
| Hardware Availability: | Feb-2011 | Software Availability: | Apr-2011 | Publication: | Nov 2, 2011 |
| System Source: | Single Supplier | System Designation: | Server | Power Provisioning: | Line-powered |
| Target Load | Actual Load | ssj_ops | |
|---|---|---|---|
| Target | Actual | ||
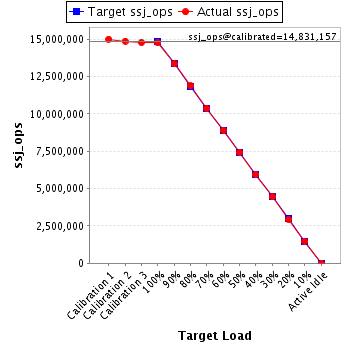
| Calibration 1 | 15,008,200 | ||
| Calibration 2 | 14,873,791 | ||
| Calibration 3 | 14,788,524 | ||
| ssj_ops@calibrated=14,831,157 | |||
| 100% | 99.5% | 14,831,157 | 14,760,777 |
| 90% | 90.0% | 13,348,042 | 13,350,571 |
| 80% | 80.1% | 11,864,926 | 11,873,735 |
| 70% | 70.0% | 10,381,810 | 10,380,082 |
| 60% | 60.0% | 8,898,694 | 8,898,547 |
| 50% | 50.0% | 7,415,579 | 7,409,434 |
| 40% | 40.0% | 5,932,463 | 5,934,281 |
| 30% | 30.0% | 4,449,347 | 4,451,168 |
| 20% | 20.0% | 2,966,231 | 2,960,845 |
| 10% | 10.0% | 1,483,116 | 1,482,515 |
| Active Idle | 0 | 0 | |
| # of Nodes | # of Chips | # of Cores | # of Threads | Total RAM (GB) | # of OS Images | # of JVM Instances |
|---|---|---|---|---|---|---|
| 16 | 32 | 192 | 384 | 384 | 16 | 32 |
| Set Identifier: | sut |
| Set Description: | PowerEdge M610 |
| # of Identical Nodes: | 16 |
| Comment: | None |
| Hardware per Node | |
|---|---|
| Hardware Vendor: | Dell Inc. |
| Model: | PowerEdge M610 |
| Form Factor: | Blade |
| CPU Name: | Intel Xeon X5675 (3.06 GHz) |
| CPU Characteristics: | 6 Core, 3.06 GHz, 12 MB L3 Cache |
| CPU Frequency (MHz): | 3060 |
| CPU(s) Enabled: | 12 cores, 2 chips, 6 cores/chip |
| Hardware Threads: | 24 (2 / core) |
| CPU(s) Orderable: | 1,2 chips |
| Primary Cache: | 32 KB I + 32 KB D on chip per core |
| Secondary Cache: | 256 KB I+D on chip per core |
| Tertiary Cache: | 12 MB I+D on chip per chip |
| Other Cache: | None |
| Memory Amount (GB): | 24 |
| # and size of DIMM: | 6 x 4096 MB |
| Memory Details: | 4GB 2Rx8 PC3L-10600R ECC RDIMM, Slots A1, A2, A3, B1, B2, B3 populated |
| Power Supply Quantity and Rating (W): | None |
| Power Supply Details: | Shared |
| Disk Drive: | 1 x 50 GB 2.5" SSD SATA (Dell PN X2N7H) |
| Disk Controller: | Modular SATA Pass-Through |
| # and type of Network Interface Cards (NICs) Installed: | 1 x onboard dual-port 1 Gigabit Ethernet |
| NICs Enabled in Firmware / OS / Connected: | 2/2/1 |
| Network Speed (Mbit): | 1000 |
| Keyboard: | None |
| Mouse: | None |
| Monitor: | None |
| Optical Drives: | No |
| Other Hardware: | None |
| Software per Node | |
|---|---|
| Power Management: | Power Saver Mode in OS (See Notes) |
| Operating System (OS): | Windows 2008 Server Enterprise x64 Edition |
| OS Version: | R2 SP1 |
| Filesystem: | NTFS |
| JVM Vendor: | Oracle Corporation |
| JVM Version: | Oracle Java HotSpot(TM) 64-Bit Server VM on Windows, version 1.6.0_27 |
| JVM Command-line Options: | -server -Xmx4g -Xms4g -Xmn3500m -XX:SurvivorRatio=55 -XX:TargetSurvivorRatio=90 -XX:ParallelGCThreads=12 -XX:AllocatePrefetchDistance=256 -XX:AllocatePrefetchLines=4 -XX:LoopUnrollLimit=45 -XX:InitialTenuringThreshold=12 -XX:MaxTenuringThreshold=15 -XX:InlineSmallCode=3900 -XX:MaxInlineSize=270 -XX:FreqInlineSize=2500 -XX:+UseLargePages -XX:+UseParallelOldGC -XX:+UseCompressedStrings -XX:+AggressiveOpts |
| JVM Affinity: | start /affinity [FFF, FFF000]] |
| JVM Instances: | 2 |
| JVM Initial Heap (MB): | 4096 |
| JVM Maximum Heap (MB): | 4096 |
| JVM Address Bits: | 64 |
| Boot Firmware Version: | 3.0.0 |
| Management Firmware Version: | iDRAC 3.21 build 48 |
| Workload Version: | SSJ 1.2.6 |
| Director Location: | Controller |
| Other Software: | None |
| Host | ssj_ops@100% |
|---|---|
| M610-01 | 927,199 |
| M610-02 | 915,715 |
| M610-03 | 923,600 |
| M610-04 | 918,184 |
| M610-05 | 920,229 |
| M610-06 | 919,729 |
| M610-07 | 919,220 |
| M610-08 | 924,685 |
| M610-09 | 913,677 |
| M610-10 | 926,019 |
| M610-11 | 922,091 |
| M610-12 | 929,900 |
| M610-13 | 925,213 |
| M610-14 | 920,338 |
| M610-15 | 932,396 |
| M610-16 | 922,582 |
| ssj_ops@100% | 14,760,777 |
| ssj_ops@100% per Host | 922,549 |
| ssj_ops@100% per JVM | 461,274 |

| Target Load | Actual Load | ssj_ops | |
|---|---|---|---|
| Target | Actual | ||
| Calibration 1 | 941,572 | ||
| Calibration 2 | 936,096 | ||
| Calibration 3 | 929,547 | ||
| ssj_ops@calibrated=932,822 | |||
| 100% | 99.4% | 932,822 | 927,199 |
| 90% | 89.9% | 839,540 | 838,914 |
| 80% | 80.0% | 746,257 | 746,439 |
| 70% | 69.7% | 652,975 | 650,301 |
| 60% | 60.4% | 559,693 | 563,444 |
| 50% | 49.7% | 466,411 | 464,060 |
| 40% | 39.7% | 373,129 | 370,503 |
| 30% | 30.0% | 279,847 | 279,383 |
| 20% | 19.9% | 186,564 | 185,337 |
| 10% | 10.0% | 93,282 | 92,871 |
| Active Idle | 0 | 0 | |

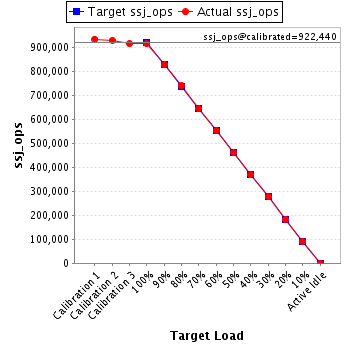
| Target Load | Actual Load | ssj_ops | |
|---|---|---|---|
| Target | Actual | ||
| Calibration 1 | 934,350 | ||
| Calibration 2 | 929,197 | ||
| Calibration 3 | 915,684 | ||
| ssj_ops@calibrated=922,440 | |||
| 100% | 99.3% | 922,440 | 915,715 |
| 90% | 89.7% | 830,196 | 827,442 |
| 80% | 80.2% | 737,952 | 740,236 |
| 70% | 69.9% | 645,708 | 644,429 |
| 60% | 59.9% | 553,464 | 552,846 |
| 50% | 49.9% | 461,220 | 460,367 |
| 40% | 39.9% | 368,976 | 368,388 |
| 30% | 30.2% | 276,732 | 278,803 |
| 20% | 19.8% | 184,488 | 182,820 |
| 10% | 10.0% | 92,244 | 91,807 |
| Active Idle | 0 | 0 | |
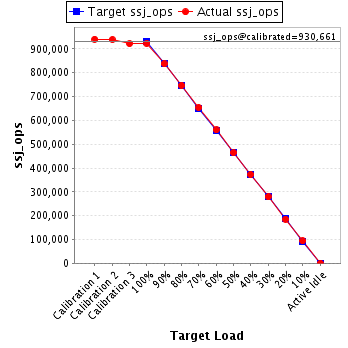
| Target Load | Actual Load | ssj_ops | |
|---|---|---|---|
| Target | Actual | ||
| Calibration 1 | 941,129 | ||
| Calibration 2 | 939,215 | ||
| Calibration 3 | 922,107 | ||
| ssj_ops@calibrated=930,661 | |||
| 100% | 99.2% | 930,661 | 923,600 |
| 90% | 90.0% | 837,595 | 837,363 |
| 80% | 80.3% | 744,529 | 747,244 |
| 70% | 70.3% | 651,463 | 653,914 |
| 60% | 60.2% | 558,397 | 560,264 |
| 50% | 49.9% | 465,331 | 464,002 |
| 40% | 40.0% | 372,264 | 372,163 |
| 30% | 30.0% | 279,198 | 279,008 |
| 20% | 19.9% | 186,132 | 185,537 |
| 10% | 10.1% | 93,066 | 93,640 |
| Active Idle | 0 | 0 | |
| Target Load | Actual Load | ssj_ops | |
|---|---|---|---|
| Target | Actual | ||
| Calibration 1 | 936,851 | ||
| Calibration 2 | 921,759 | ||
| Calibration 3 | 920,902 | ||
| ssj_ops@calibrated=921,331 | |||
| 100% | 99.7% | 921,331 | 918,184 |
| 90% | 89.8% | 829,198 | 827,367 |
| 80% | 80.1% | 737,064 | 737,712 |
| 70% | 69.9% | 644,931 | 643,875 |
| 60% | 59.7% | 552,798 | 550,250 |
| 50% | 49.6% | 460,665 | 457,124 |
| 40% | 40.1% | 368,532 | 369,237 |
| 30% | 30.0% | 276,399 | 276,691 |
| 20% | 19.8% | 184,266 | 182,806 |
| 10% | 10.0% | 92,133 | 92,587 |
| Active Idle | 0 | 0 | |

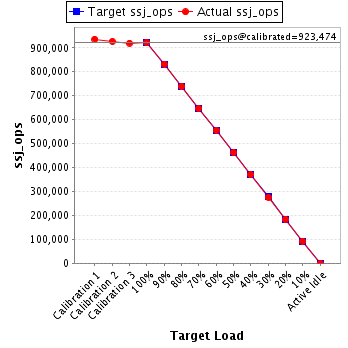
| Target Load | Actual Load | ssj_ops | |
|---|---|---|---|
| Target | Actual | ||
| Calibration 1 | 936,177 | ||
| Calibration 2 | 926,908 | ||
| Calibration 3 | 920,040 | ||
| ssj_ops@calibrated=923,474 | |||
| 100% | 99.6% | 923,474 | 920,229 |
| 90% | 90.1% | 831,127 | 832,420 |
| 80% | 79.9% | 738,779 | 738,200 |
| 70% | 70.1% | 646,432 | 647,025 |
| 60% | 60.2% | 554,084 | 555,656 |
| 50% | 50.1% | 461,737 | 462,527 |
| 40% | 40.1% | 369,390 | 370,061 |
| 30% | 29.8% | 277,042 | 275,026 |
| 20% | 20.0% | 184,695 | 184,313 |
| 10% | 10.0% | 92,347 | 92,809 |
| Active Idle | 0 | 0 | |
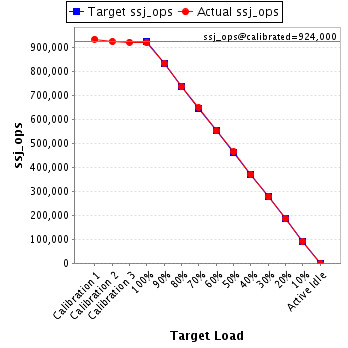
| Target Load | Actual Load | ssj_ops | |
|---|---|---|---|
| Target | Actual | ||
| Calibration 1 | 934,948 | ||
| Calibration 2 | 925,138 | ||
| Calibration 3 | 922,862 | ||
| ssj_ops@calibrated=924,000 | |||
| 100% | 99.5% | 924,000 | 919,729 |
| 90% | 90.3% | 831,600 | 834,658 |
| 80% | 79.7% | 739,200 | 736,084 |
| 70% | 70.3% | 646,800 | 649,402 |
| 60% | 59.8% | 554,400 | 552,265 |
| 50% | 50.3% | 462,000 | 464,635 |
| 40% | 40.1% | 369,600 | 370,180 |
| 30% | 30.0% | 277,200 | 277,455 |
| 20% | 20.1% | 184,800 | 185,792 |
| 10% | 10.0% | 92,400 | 92,454 |
| Active Idle | 0 | 0 | |
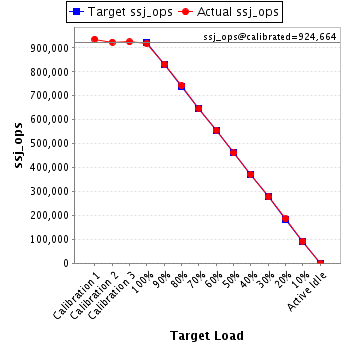
| Target Load | Actual Load | ssj_ops | |
|---|---|---|---|
| Target | Actual | ||
| Calibration 1 | 936,536 | ||
| Calibration 2 | 924,548 | ||
| Calibration 3 | 924,781 | ||
| ssj_ops@calibrated=924,664 | |||
| 100% | 99.4% | 924,664 | 919,220 |
| 90% | 90.1% | 832,198 | 832,722 |
| 80% | 80.4% | 739,731 | 743,642 |
| 70% | 69.9% | 647,265 | 645,956 |
| 60% | 60.2% | 554,799 | 556,820 |
| 50% | 49.9% | 462,332 | 461,047 |
| 40% | 40.1% | 369,866 | 371,152 |
| 30% | 30.0% | 277,399 | 276,956 |
| 20% | 20.1% | 184,933 | 186,080 |
| 10% | 10.0% | 92,466 | 92,089 |
| Active Idle | 0 | 0 | |
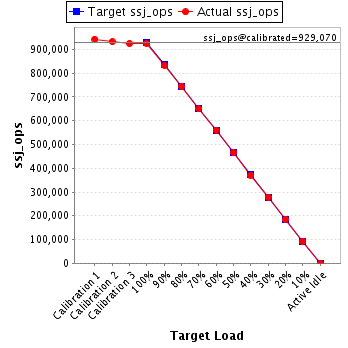
| Target Load | Actual Load | ssj_ops | |
|---|---|---|---|
| Target | Actual | ||
| Calibration 1 | 943,467 | ||
| Calibration 2 | 932,814 | ||
| Calibration 3 | 925,326 | ||
| ssj_ops@calibrated=929,070 | |||
| 100% | 99.5% | 929,070 | 924,685 |
| 90% | 89.7% | 836,163 | 833,601 |
| 80% | 80.1% | 743,256 | 744,476 |
| 70% | 70.0% | 650,349 | 650,018 |
| 60% | 60.4% | 557,442 | 560,795 |
| 50% | 50.1% | 464,535 | 465,413 |
| 40% | 40.0% | 371,628 | 371,298 |
| 30% | 30.0% | 278,721 | 278,869 |
| 20% | 19.9% | 185,814 | 185,239 |
| 10% | 9.9% | 92,907 | 92,366 |
| Active Idle | 0 | 0 | |
| Target Load | Actual Load | ssj_ops | |
|---|---|---|---|
| Target | Actual | ||
| Calibration 1 | 924,748 | ||
| Calibration 2 | 916,990 | ||
| Calibration 3 | 915,316 | ||
| ssj_ops@calibrated=916,153 | |||
| 100% | 99.7% | 916,153 | 913,677 |
| 90% | 90.0% | 824,538 | 824,369 |
| 80% | 79.7% | 732,922 | 730,365 |
| 70% | 70.0% | 641,307 | 641,647 |
| 60% | 59.8% | 549,692 | 547,471 |
| 50% | 49.9% | 458,076 | 457,140 |
| 40% | 39.9% | 366,461 | 365,332 |
| 30% | 30.2% | 274,846 | 277,023 |
| 20% | 20.1% | 183,231 | 184,258 |
| 10% | 10.0% | 91,615 | 91,737 |
| Active Idle | 0 | 0 | |

| Target Load | Actual Load | ssj_ops | |
|---|---|---|---|
| Target | Actual | ||
| Calibration 1 | 939,876 | ||
| Calibration 2 | 932,565 | ||
| Calibration 3 | 925,366 | ||
| ssj_ops@calibrated=928,966 | |||
| 100% | 99.7% | 928,966 | 926,019 |
| 90% | 90.2% | 836,069 | 838,359 |
| 80% | 79.9% | 743,173 | 742,446 |
| 70% | 70.0% | 650,276 | 650,426 |
| 60% | 59.8% | 557,379 | 555,701 |
| 50% | 50.0% | 464,483 | 464,555 |
| 40% | 40.1% | 371,586 | 372,339 |
| 30% | 30.0% | 278,690 | 278,526 |
| 20% | 19.9% | 185,793 | 185,076 |
| 10% | 9.9% | 92,897 | 92,148 |
| Active Idle | 0 | 0 | |

| Target Load | Actual Load | ssj_ops | |
|---|---|---|---|
| Target | Actual | ||
| Calibration 1 | 936,342 | ||
| Calibration 2 | 931,788 | ||
| Calibration 3 | 920,666 | ||
| ssj_ops@calibrated=926,227 | |||
| 100% | 99.6% | 926,227 | 922,091 |
| 90% | 90.1% | 833,604 | 834,534 |
| 80% | 79.7% | 740,982 | 738,474 |
| 70% | 70.1% | 648,359 | 648,863 |
| 60% | 59.9% | 555,736 | 554,374 |
| 50% | 50.0% | 463,113 | 462,655 |
| 40% | 39.9% | 370,491 | 369,885 |
| 30% | 30.1% | 277,868 | 279,029 |
| 20% | 20.0% | 185,245 | 185,288 |
| 10% | 10.0% | 92,623 | 92,794 |
| Active Idle | 0 | 0 | |

| Target Load | Actual Load | ssj_ops | |
|---|---|---|---|
| Target | Actual | ||
| Calibration 1 | 935,462 | ||
| Calibration 2 | 935,244 | ||
| Calibration 3 | 932,544 | ||
| ssj_ops@calibrated=933,894 | |||
| 100% | 99.6% | 933,894 | 929,900 |
| 90% | 90.2% | 840,505 | 842,643 |
| 80% | 80.2% | 747,115 | 748,790 |
| 70% | 70.0% | 653,726 | 653,488 |
| 60% | 60.3% | 560,337 | 562,680 |
| 50% | 50.3% | 466,947 | 469,286 |
| 40% | 40.1% | 373,558 | 374,830 |
| 30% | 29.9% | 280,168 | 279,561 |
| 20% | 19.7% | 186,779 | 183,922 |
| 10% | 10.0% | 93,389 | 93,255 |
| Active Idle | 0 | 0 | |

| Target Load | Actual Load | ssj_ops | |
|---|---|---|---|
| Target | Actual | ||
| Calibration 1 | 939,860 | ||
| Calibration 2 | 927,083 | ||
| Calibration 3 | 927,413 | ||
| ssj_ops@calibrated=927,248 | |||
| 100% | 99.8% | 927,248 | 925,213 |
| 90% | 89.7% | 834,523 | 831,602 |
| 80% | 80.2% | 741,798 | 743,345 |
| 70% | 70.1% | 649,073 | 650,200 |
| 60% | 59.8% | 556,349 | 554,823 |
| 50% | 50.1% | 463,624 | 464,337 |
| 40% | 40.1% | 370,899 | 371,799 |
| 30% | 29.9% | 278,174 | 276,907 |
| 20% | 19.9% | 185,450 | 184,950 |
| 10% | 10.1% | 92,725 | 93,283 |
| Active Idle | 0 | 0 | |

| Target Load | Actual Load | ssj_ops | |
|---|---|---|---|
| Target | Actual | ||
| Calibration 1 | 937,698 | ||
| Calibration 2 | 933,088 | ||
| Calibration 3 | 923,415 | ||
| ssj_ops@calibrated=928,251 | |||
| 100% | 99.1% | 928,251 | 920,338 |
| 90% | 89.9% | 835,426 | 834,303 |
| 80% | 80.1% | 742,601 | 743,645 |
| 70% | 69.9% | 649,776 | 648,587 |
| 60% | 59.9% | 556,951 | 556,431 |
| 50% | 50.0% | 464,126 | 464,115 |
| 40% | 40.1% | 371,301 | 372,180 |
| 30% | 30.2% | 278,475 | 280,116 |
| 20% | 19.9% | 185,650 | 185,057 |
| 10% | 10.1% | 92,825 | 93,861 |
| Active Idle | 0 | 0 | |

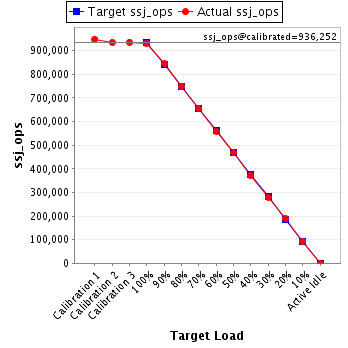
| Target Load | Actual Load | ssj_ops | |
|---|---|---|---|
| Target | Actual | ||
| Calibration 1 | 949,169 | ||
| Calibration 2 | 935,636 | ||
| Calibration 3 | 936,868 | ||
| ssj_ops@calibrated=936,252 | |||
| 100% | 99.6% | 936,252 | 932,396 |
| 90% | 90.2% | 842,627 | 844,866 |
| 80% | 80.2% | 749,001 | 750,730 |
| 70% | 69.9% | 655,376 | 654,787 |
| 60% | 59.8% | 561,751 | 559,980 |
| 50% | 49.9% | 468,126 | 467,291 |
| 40% | 39.8% | 374,501 | 372,773 |
| 30% | 30.0% | 280,876 | 280,642 |
| 20% | 20.2% | 187,250 | 188,834 |
| 10% | 9.9% | 93,625 | 92,506 |
| Active Idle | 0 | 0 | |
| Target Load | Actual Load | ssj_ops | |
|---|---|---|---|
| Target | Actual | ||
| Calibration 1 | 940,015 | ||
| Calibration 2 | 925,722 | ||
| Calibration 3 | 925,686 | ||
| ssj_ops@calibrated=925,704 | |||
| 100% | 99.7% | 925,704 | 922,582 |
| 90% | 90.2% | 833,134 | 835,406 |
| 80% | 80.1% | 740,563 | 741,909 |
| 70% | 69.9% | 647,993 | 647,163 |
| 60% | 59.9% | 555,423 | 554,746 |
| 50% | 49.8% | 462,852 | 460,879 |
| 40% | 40.2% | 370,282 | 372,163 |
| 30% | 29.9% | 277,711 | 277,172 |
| 20% | 20.0% | 185,141 | 185,537 |
| 10% | 10.0% | 92,570 | 92,307 |
| Active Idle | 0 | 0 | |
