
SPECpower_ssj2008
Host 'steel1' Performance Report
Copyright © 2007-2012 Standard Performance Evaluation Corporation
| SGI Rackable C2112-4RP4 | ssj_ops@100% = 1,454,026 ssj_ops@100% per JVM = 181,753 |
||||
| Test Sponsor: | SGI | SPEC License #: | 4 | Test Method: | Multi Node |
| Tested By: | SGI | Test Location: | Fremont, CA, USA | Test Date: | Oct 2, 2012 |
| Hardware Availability: | Aug-2012 | Software Availability: | Jun-2012 | Publication: | Oct 17, 2012 |
| System Source: | Single Supplier | System Designation: | Server | Power Provisioning: | Line-powered |
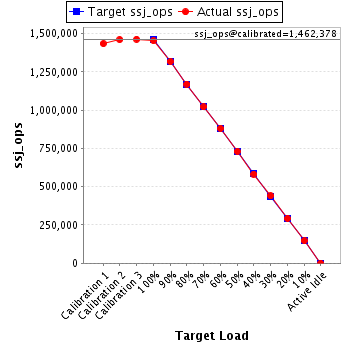
| Target Load | Actual Load | ssj_ops | |
|---|---|---|---|
| Target | Actual | ||
| Calibration 1 | 1,434,451 | ||
| Calibration 2 | 1,460,759 | ||
| Calibration 3 | 1,463,997 | ||
| ssj_ops@calibrated=1,462,378 | |||
| 100% | 99.4% | 1,462,378 | 1,454,026 |
| 90% | 90.1% | 1,316,140 | 1,318,314 |
| 80% | 80.0% | 1,169,902 | 1,170,580 |
| 70% | 69.8% | 1,023,665 | 1,021,047 |
| 60% | 60.2% | 877,427 | 880,917 |
| 50% | 50.0% | 731,189 | 731,147 |
| 40% | 39.9% | 584,951 | 582,784 |
| 30% | 30.1% | 438,713 | 439,631 |
| 20% | 20.1% | 292,476 | 293,284 |
| 10% | 10.0% | 146,238 | 146,937 |
| Active Idle | 0 | 0 | |
| Set Identifier: | sut |
| Set Description: | Rackable C2112-4RP4 |
| # of Identical Nodes: | 4 |
| Comment: | None |
| Hardware | |
|---|---|
| Hardware Vendor: | SGI |
| Model: | Rackable C2112-4RP4 |
| Form Factor: | Blade |
| CPU Name: | Intel Xeon E5-2660 |
| CPU Characteristics: | 8-Core, 2.20 GHz, 20 MB L3 Cache (Turbo Boost Technology up to 3.0 GHz) |
| CPU Frequency (MHz): | 2200 |
| CPU(s) Enabled: | 16 cores, 2 chips, 8 cores/chip |
| Hardware Threads: | 32 (2 / core) |
| CPU(s) Orderable: | 1,2 chips |
| Primary Cache: | 32 KB I + 32 KB D on chip per core |
| Secondary Cache: | 256 KB I+D on chip per core |
| Tertiary Cache: | 20 MB I+D on chip per chip |
| Other Cache: | None |
| Memory Amount (GB): | 24 |
| # and size of DIMM: | 6 x 4096 MB |
| Memory Details: | 4 GB 2Rx8 PC3L-10600R slots A1,B1 C1,E1,F1 and G1 are populated. |
| Power Supply Quantity and Rating (W): | None |
| Power Supply Details: | N/A |
| Disk Drive: | 1 x 120 GB 2.5" SSD SATA (SGI PN LSX-SSD25-120G-I) |
| Disk Controller: | Integrated SATA controller |
| # and type of Network Interface Cards (NICs) Installed: | 1 x Dual port Integrated Intel(R) I350 Gigabit Ethernet Controller |
| NICs Enabled in Firmware / OS / Connected: | 2/2/1 |
| Network Speed (Mbit): | 1000 |
| Keyboard: | None |
| Mouse: | None |
| Monitor: | None |
| Optical Drives: | No |
| Other Hardware: | None |
| Software | |
|---|---|
| Power Management: | Power Saver Enabled in OS |
| Operating System (OS): | Microsoft Windows Server 2008 Datacenter Edition |
| OS Version: | R2 |
| Filesystem: | NTFS |
| JVM Vendor: | IBM Corporation |
| JVM Version: | IBM J9 VM (build 2.6,JRE 1.7.0 Windows Server 2008 R2 amd64-64 20120322_106209 (JIT enabled, AOT enabled) |
| JVM Command-line Options: | -Xaggressive -Xcompressedrefs -Xmx1600m -Xms1600m -Xmn1200m -XlockReservation -Xnoloa -XtlhPrefetch -Xlp -Xconcurrentlevel0 |
| JVM Affinity: | start /affinity [F, F0, F00, F000, F0000, F00000, F000000, F0000000] |
| JVM Instances: | 8 |
| JVM Initial Heap (MB): | 1600 |
| JVM Maximum Heap (MB): | 1600 |
| JVM Address Bits: | 64 |
| Boot Firmware Version: | SE5C600.86B.01.03.0002 dt 06/20/2012 |
| Management Firmware Version: | none |
| Workload Version: | SSJ 1.2.9 |
| Director Location: | Controller |
| Other Software: | IBM SDK Java Technology Edition Version 7.0 for Windows x64 |
| JVM Instance | ssj_ops@100% |
|---|---|
| steel1.001 | 182,451 |
| steel1.002 | 181,343 |
| steel1.003 | 181,034 |
| steel1.004 | 182,310 |
| steel1.005 | 181,463 |
| steel1.006 | 182,629 |
| steel1.007 | 180,026 |
| steel1.008 | 182,769 |
| ssj_ops@100% | 1,454,026 |
| ssj_ops@100% per JVM | 181,753 |

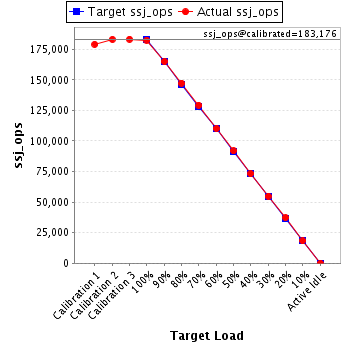
| Target Load | Actual Load | ssj_ops | |
|---|---|---|---|
| Target | Actual | ||
| Calibration 1 | 179,122 | ||
| Calibration 2 | 183,088 | ||
| Calibration 3 | 183,264 | ||
| ssj_ops@calibrated=183,176 | |||
| 100% | 99.6% | 183,176 | 182,451 |
| 90% | 90.1% | 164,858 | 165,006 |
| 80% | 80.5% | 146,541 | 147,379 |
| 70% | 70.6% | 128,223 | 129,344 |
| 60% | 60.2% | 109,905 | 110,243 |
| 50% | 50.1% | 91,588 | 91,848 |
| 40% | 40.0% | 73,270 | 73,246 |
| 30% | 30.0% | 54,953 | 54,918 |
| 20% | 20.3% | 36,635 | 37,202 |
| 10% | 10.0% | 18,318 | 18,296 |
| Active Idle | 0 | 0 | |
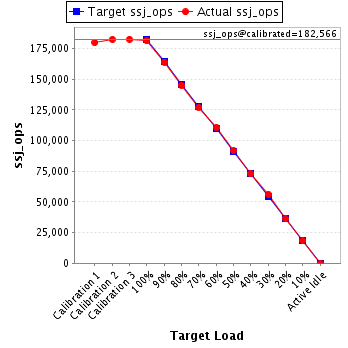
| Target Load | Actual Load | ssj_ops | |
|---|---|---|---|
| Target | Actual | ||
| Calibration 1 | 179,907 | ||
| Calibration 2 | 182,406 | ||
| Calibration 3 | 182,726 | ||
| ssj_ops@calibrated=182,566 | |||
| 100% | 99.3% | 182,566 | 181,343 |
| 90% | 89.9% | 164,309 | 164,106 |
| 80% | 79.6% | 146,053 | 145,232 |
| 70% | 69.7% | 127,796 | 127,162 |
| 60% | 60.6% | 109,540 | 110,683 |
| 50% | 50.2% | 91,283 | 91,715 |
| 40% | 39.9% | 73,026 | 72,855 |
| 30% | 30.8% | 54,770 | 56,222 |
| 20% | 19.8% | 36,513 | 36,111 |
| 10% | 10.0% | 18,257 | 18,312 |
| Active Idle | 0 | 0 | |
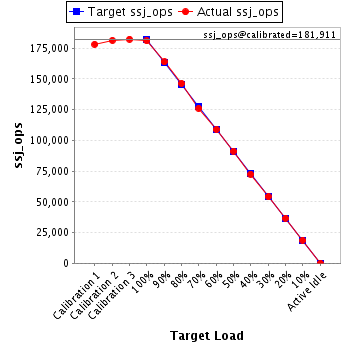
| Target Load | Actual Load | ssj_ops | |
|---|---|---|---|
| Target | Actual | ||
| Calibration 1 | 178,249 | ||
| Calibration 2 | 181,403 | ||
| Calibration 3 | 182,419 | ||
| ssj_ops@calibrated=181,911 | |||
| 100% | 99.5% | 181,911 | 181,034 |
| 90% | 90.1% | 163,720 | 163,880 |
| 80% | 80.5% | 145,529 | 146,397 |
| 70% | 69.4% | 127,338 | 126,168 |
| 60% | 59.9% | 109,147 | 108,985 |
| 50% | 50.2% | 90,955 | 91,367 |
| 40% | 39.9% | 72,764 | 72,538 |
| 30% | 29.8% | 54,573 | 54,119 |
| 20% | 20.2% | 36,382 | 36,733 |
| 10% | 10.4% | 18,191 | 18,841 |
| Active Idle | 0 | 0 | |
| Target Load | Actual Load | ssj_ops | |
|---|---|---|---|
| Target | Actual | ||
| Calibration 1 | 179,971 | ||
| Calibration 2 | 183,624 | ||
| Calibration 3 | 183,557 | ||
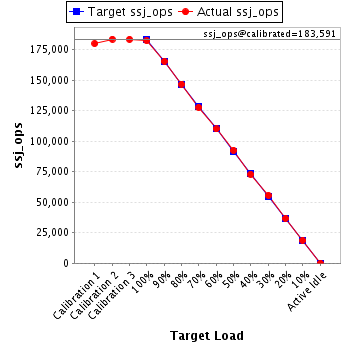
| ssj_ops@calibrated=183,591 | |||
| 100% | 99.3% | 183,591 | 182,310 |
| 90% | 90.2% | 165,232 | 165,514 |
| 80% | 80.0% | 146,873 | 146,881 |
| 70% | 69.6% | 128,513 | 127,695 |
| 60% | 59.9% | 110,154 | 110,054 |
| 50% | 50.4% | 91,795 | 92,599 |
| 40% | 39.7% | 73,436 | 72,897 |
| 30% | 30.3% | 55,077 | 55,656 |
| 20% | 20.0% | 36,718 | 36,795 |
| 10% | 10.2% | 18,359 | 18,812 |
| Active Idle | 0 | 0 | |
| Target Load | Actual Load | ssj_ops | |
|---|---|---|---|
| Target | Actual | ||
| Calibration 1 | 179,461 | ||
| Calibration 2 | 182,141 | ||
| Calibration 3 | 183,428 | ||
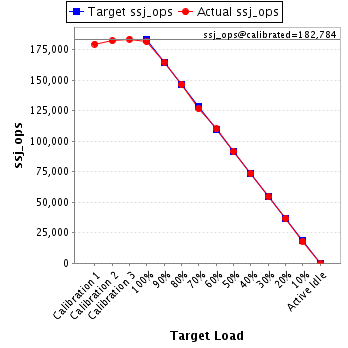
| ssj_ops@calibrated=182,784 | |||
| 100% | 99.3% | 182,784 | 181,463 |
| 90% | 90.0% | 164,506 | 164,514 |
| 80% | 80.0% | 146,227 | 146,223 |
| 70% | 69.3% | 127,949 | 126,661 |
| 60% | 60.1% | 109,671 | 109,940 |
| 50% | 50.0% | 91,392 | 91,408 |
| 40% | 40.2% | 73,114 | 73,413 |
| 30% | 29.8% | 54,835 | 54,487 |
| 20% | 20.0% | 36,557 | 36,577 |
| 10% | 9.9% | 18,278 | 18,026 |
| Active Idle | 0 | 0 | |
| Target Load | Actual Load | ssj_ops | |
|---|---|---|---|
| Target | Actual | ||
| Calibration 1 | 179,241 | ||
| Calibration 2 | 182,844 | ||
| Calibration 3 | 183,211 | ||
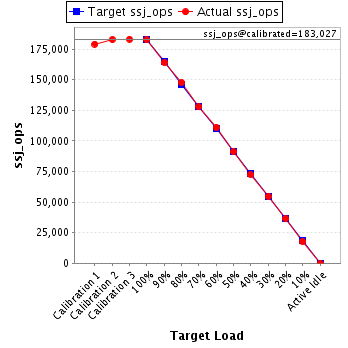
| ssj_ops@calibrated=183,027 | |||
| 100% | 99.8% | 183,027 | 182,629 |
| 90% | 89.7% | 164,725 | 164,185 |
| 80% | 80.7% | 146,422 | 147,634 |
| 70% | 69.8% | 128,119 | 127,830 |
| 60% | 60.7% | 109,816 | 111,117 |
| 50% | 49.8% | 91,514 | 91,089 |
| 40% | 39.6% | 73,211 | 72,432 |
| 30% | 29.9% | 54,908 | 54,733 |
| 20% | 19.9% | 36,605 | 36,483 |
| 10% | 9.7% | 18,303 | 17,662 |
| Active Idle | 0 | 0 | |
| Target Load | Actual Load | ssj_ops | |
|---|---|---|---|
| Target | Actual | ||
| Calibration 1 | 178,495 | ||
| Calibration 2 | 181,548 | ||
| Calibration 3 | 181,161 | ||
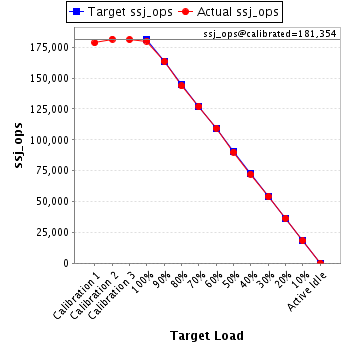
| ssj_ops@calibrated=181,354 | |||
| 100% | 99.3% | 181,354 | 180,026 |
| 90% | 90.2% | 163,219 | 163,527 |
| 80% | 79.2% | 145,084 | 143,638 |
| 70% | 70.0% | 126,948 | 126,998 |
| 60% | 60.3% | 108,813 | 109,440 |
| 50% | 49.7% | 90,677 | 90,097 |
| 40% | 39.7% | 72,542 | 72,083 |
| 30% | 29.8% | 54,406 | 54,016 |
| 20% | 20.1% | 36,271 | 36,491 |
| 10% | 10.0% | 18,135 | 18,223 |
| Active Idle | 0 | 0 | |
| Target Load | Actual Load | ssj_ops | |
|---|---|---|---|
| Target | Actual | ||
| Calibration 1 | 180,006 | ||
| Calibration 2 | 183,706 | ||
| Calibration 3 | 184,231 | ||
| ssj_ops@calibrated=183,969 | |||
| 100% | 99.3% | 183,969 | 182,769 |
| 90% | 91.1% | 165,572 | 167,582 |
| 80% | 80.0% | 147,175 | 147,196 |
| 70% | 70.2% | 128,778 | 129,188 |
| 60% | 60.0% | 110,381 | 110,455 |
| 50% | 49.5% | 91,984 | 91,023 |
| 40% | 39.9% | 73,587 | 73,321 |
| 30% | 30.2% | 55,191 | 55,479 |
| 20% | 20.1% | 36,794 | 36,892 |
| 10% | 10.2% | 18,397 | 18,764 |
| Active Idle | 0 | 0 | |
