
SPECpower_ssj2008
Host 'M620-10' Performance Report
Copyright © 2007-2013 Standard Performance Evaluation Corporation
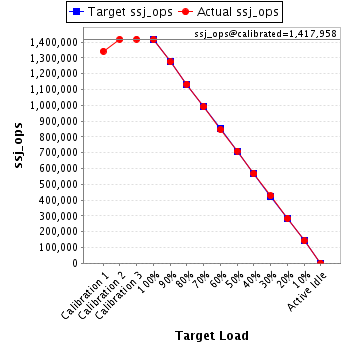
| Dell Inc. PowerEdge M620 (Intel Xeon E5-2670, 2.60 GHz) | ssj_ops@100% = 1,416,732 ssj_ops@100% per JVM = 88,546 |
||||
| Test Sponsor: | Dell Inc. | SPEC License #: | 55 | Test Method: | Multi Node |
| Tested By: | Dell Inc. | Test Location: | Round Rock, TX, USA | Test Date: | Jan 11, 2013 |
| Hardware Availability: | Dec-2012 | Software Availability: | Jun-2012 | Publication: | Feb 20, 2013 |
| System Source: | Single Supplier | System Designation: | Server | Power Provisioning: | Line-powered |
| Target Load | Actual Load | ssj_ops | |
|---|---|---|---|
| Target | Actual | ||
| Calibration 1 | 1,342,154 | ||
| Calibration 2 | 1,417,425 | ||
| Calibration 3 | 1,418,492 | ||
| ssj_ops@calibrated=1,417,958 | |||
| 100% | 99.9% | 1,417,958 | 1,416,732 |
| 90% | 89.9% | 1,276,163 | 1,275,144 |
| 80% | 79.9% | 1,134,367 | 1,132,848 |
| 70% | 69.8% | 992,571 | 990,307 |
| 60% | 59.7% | 850,775 | 846,391 |
| 50% | 50.1% | 708,979 | 710,471 |
| 40% | 40.0% | 567,183 | 566,759 |
| 30% | 30.1% | 425,388 | 426,190 |
| 20% | 20.0% | 283,592 | 283,763 |
| 10% | 10.0% | 141,796 | 142,385 |
| Active Idle | 0 | 0 | |
| Set Identifier: | sut |
| Set Description: | M620 |
| # of Identical Nodes: | 16 |
| Comment: | None |
| Hardware | |
|---|---|
| Hardware Vendor: | Dell Inc. |
| Model: | PowerEdge M620 (Intel Xeon E5-2670, 2.60 GHz) |
| Form Factor: | Blade |
| CPU Name: | Intel Xeon E5-2670 2.60 GHz |
| CPU Characteristics: | 8 Core, 2.60 GHz, 20MB L3 Cache |
| CPU Frequency (MHz): | 2600 |
| CPU(s) Enabled: | 16 cores, 2 chips, 8 cores/chip |
| Hardware Threads: | 32 (2 / core) |
| CPU(s) Orderable: | 1,2 chips |
| Primary Cache: | 32 KB I + 32 KB D on chip per core |
| Secondary Cache: | 256 KB I+D on chip per chip |
| Tertiary Cache: | 20 MB I+D on chip per chip |
| Other Cache: | None |
| Memory Amount (GB): | 24 |
| # and size of DIMM: | 6 x 4096 MB |
| Memory Details: | 4GB 2Rx8 PC3L-10600E-9 ECC, Slots A1-3, B1-3 populated |
| Power Supply Quantity and Rating (W): | None |
| Power Supply Details: | Shared |
| Disk Drive: | 1 x 100 GB 2.5" SATA SSD, Dell P/N: DYW42 |
| Disk Controller: | Integrated PERC S110 |
| # and type of Network Interface Cards (NICs) Installed: | 1 x Onboard Dual-Port Intel X520-k Gigabit Ethernet |
| NICs Enabled in Firmware / OS / Connected: | 2/2/1 |
| Network Speed (Mbit): | 1000 |
| Keyboard: | None |
| Mouse: | None |
| Monitor: | None |
| Optical Drives: | No |
| Other Hardware: | None |
| Software | |
|---|---|
| Power Management: | Power Saver Mode in OS (See Notes) |
| Operating System (OS): | Microsoft Windows Server 2008 Enterprise x64 Edition |
| OS Version: | R2 SP1 |
| Filesystem: | NTFS |
| JVM Vendor: | IBM Corporation |
| JVM Version: | IBM J9 VM (build 2.6, JRE 1.7.0 Windows Server 2008 R2 amd64-64 20120322_106209 (JIT enabled, AOT enabled) |
| JVM Command-line Options: | -Xaggressive -Xcompressedrefs -Xmn800m -Xms1024m -Xmx1024m -XlockReservation -Xnoloa -Xlp -Xconcurrentlevel0 -XtlhPrefetch -Xthr:minimizeusercpu -Xgcthreads4 |
| JVM Affinity: | start /affinity [3, C, 30, C0, 300, C00, 3000, C000, 30000, C0000, 300000, C00000, 3000000, C0000000, 30000000, C0000000] |
| JVM Instances: | 16 |
| JVM Initial Heap (MB): | 1024 |
| JVM Maximum Heap (MB): | 1024 |
| JVM Address Bits: | 64 |
| Boot Firmware Version: | 1.4.9 |
| Management Firmware Version: | iDRAC7 1.30.30 (Build 39) |
| Workload Version: | SSJ 1.2.10 |
| Director Location: | Controller |
| Other Software: | IBM SDK Java Technology Edition Version 7.0 for Windows x64 |
| JVM Instance | ssj_ops@100% |
|---|---|
| M620-10.001 | 88,317 |
| M620-10.002 | 88,566 |
| M620-10.003 | 88,912 |
| M620-10.004 | 88,421 |
| M620-10.005 | 88,055 |
| M620-10.006 | 87,817 |
| M620-10.007 | 88,014 |
| M620-10.008 | 89,523 |
| M620-10.009 | 88,552 |
| M620-10.010 | 88,500 |
| M620-10.011 | 88,782 |
| M620-10.012 | 89,432 |
| M620-10.013 | 88,172 |
| M620-10.014 | 89,412 |
| M620-10.015 | 88,891 |
| M620-10.016 | 87,366 |
| ssj_ops@100% | 1,416,732 |
| ssj_ops@100% per JVM | 88,546 |
| Target Load | Actual Load | ssj_ops | |
|---|---|---|---|
| Target | Actual | ||
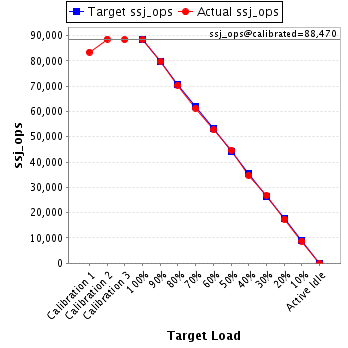
| Calibration 1 | 83,445 | ||
| Calibration 2 | 88,558 | ||
| Calibration 3 | 88,383 | ||
| ssj_ops@calibrated=88,470 | |||
| 100% | 99.8% | 88,470 | 88,317 |
| 90% | 90.1% | 79,623 | 79,729 |
| 80% | 79.6% | 70,776 | 70,445 |
| 70% | 69.3% | 61,929 | 61,285 |
| 60% | 59.6% | 53,082 | 52,765 |
| 50% | 50.5% | 44,235 | 44,645 |
| 40% | 39.3% | 35,388 | 34,748 |
| 30% | 30.3% | 26,541 | 26,778 |
| 20% | 19.7% | 17,694 | 17,473 |
| 10% | 9.9% | 8,847 | 8,752 |
| Active Idle | 0 | 0 | |
| Target Load | Actual Load | ssj_ops | |
|---|---|---|---|
| Target | Actual | ||
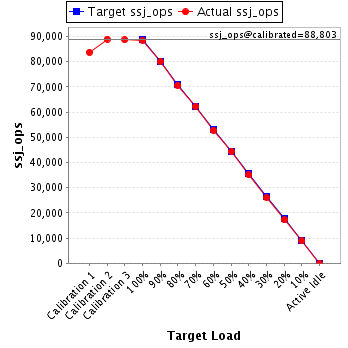
| Calibration 1 | 83,737 | ||
| Calibration 2 | 88,932 | ||
| Calibration 3 | 88,674 | ||
| ssj_ops@calibrated=88,803 | |||
| 100% | 99.7% | 88,803 | 88,566 |
| 90% | 90.1% | 79,923 | 80,039 |
| 80% | 79.6% | 71,042 | 70,649 |
| 70% | 70.1% | 62,162 | 62,269 |
| 60% | 59.4% | 53,282 | 52,761 |
| 50% | 49.9% | 44,402 | 44,302 |
| 40% | 39.5% | 35,521 | 35,069 |
| 30% | 29.4% | 26,641 | 26,095 |
| 20% | 19.4% | 17,761 | 17,193 |
| 10% | 10.0% | 8,880 | 8,875 |
| Active Idle | 0 | 0 | |
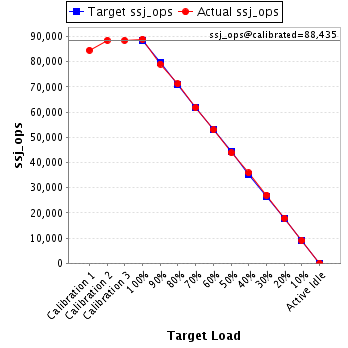
| Target Load | Actual Load | ssj_ops | |
|---|---|---|---|
| Target | Actual | ||
| Calibration 1 | 84,532 | ||
| Calibration 2 | 88,415 | ||
| Calibration 3 | 88,454 | ||
| ssj_ops@calibrated=88,435 | |||
| 100% | 100.5% | 88,435 | 88,912 |
| 90% | 89.4% | 79,591 | 79,055 |
| 80% | 80.5% | 70,748 | 71,163 |
| 70% | 69.8% | 61,904 | 61,746 |
| 60% | 59.8% | 53,061 | 52,904 |
| 50% | 49.6% | 44,217 | 43,848 |
| 40% | 40.5% | 35,374 | 35,815 |
| 30% | 30.6% | 26,530 | 27,062 |
| 20% | 20.3% | 17,687 | 17,920 |
| 10% | 10.2% | 8,843 | 9,019 |
| Active Idle | 0 | 0 | |
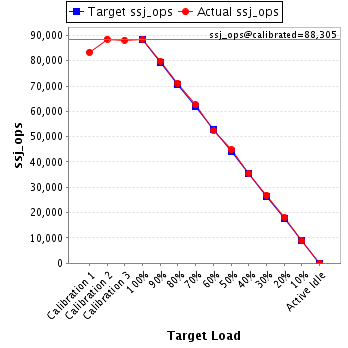
| Target Load | Actual Load | ssj_ops | |
|---|---|---|---|
| Target | Actual | ||
| Calibration 1 | 83,340 | ||
| Calibration 2 | 88,494 | ||
| Calibration 3 | 88,116 | ||
| ssj_ops@calibrated=88,305 | |||
| 100% | 100.1% | 88,305 | 88,421 |
| 90% | 90.4% | 79,474 | 79,808 |
| 80% | 80.5% | 70,644 | 71,121 |
| 70% | 70.9% | 61,813 | 62,646 |
| 60% | 59.4% | 52,983 | 52,417 |
| 50% | 50.8% | 44,152 | 44,817 |
| 40% | 40.2% | 35,322 | 35,473 |
| 30% | 30.4% | 26,491 | 26,871 |
| 20% | 20.4% | 17,661 | 18,026 |
| 10% | 10.0% | 8,830 | 8,850 |
| Active Idle | 0 | 0 | |
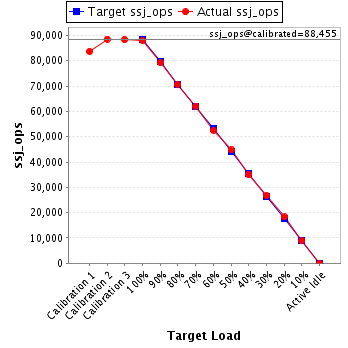
| Target Load | Actual Load | ssj_ops | |
|---|---|---|---|
| Target | Actual | ||
| Calibration 1 | 83,667 | ||
| Calibration 2 | 88,538 | ||
| Calibration 3 | 88,373 | ||
| ssj_ops@calibrated=88,455 | |||
| 100% | 99.5% | 88,455 | 88,055 |
| 90% | 89.6% | 79,610 | 79,241 |
| 80% | 79.9% | 70,764 | 70,715 |
| 70% | 70.2% | 61,919 | 62,128 |
| 60% | 59.4% | 53,073 | 52,571 |
| 50% | 50.6% | 44,228 | 44,760 |
| 40% | 39.6% | 35,382 | 35,039 |
| 30% | 30.3% | 26,537 | 26,825 |
| 20% | 20.7% | 17,691 | 18,291 |
| 10% | 10.0% | 8,846 | 8,879 |
| Active Idle | 0 | 0 | |
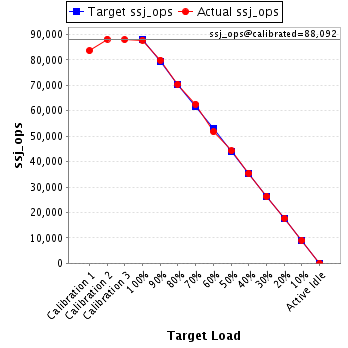
| Target Load | Actual Load | ssj_ops | |
|---|---|---|---|
| Target | Actual | ||
| Calibration 1 | 83,628 | ||
| Calibration 2 | 88,172 | ||
| Calibration 3 | 88,011 | ||
| ssj_ops@calibrated=88,092 | |||
| 100% | 99.7% | 88,092 | 87,817 |
| 90% | 90.7% | 79,283 | 79,902 |
| 80% | 79.9% | 70,473 | 70,399 |
| 70% | 71.1% | 61,664 | 62,626 |
| 60% | 58.8% | 52,855 | 51,762 |
| 50% | 50.3% | 44,046 | 44,287 |
| 40% | 40.2% | 35,237 | 35,398 |
| 30% | 29.9% | 26,428 | 26,362 |
| 20% | 20.1% | 17,618 | 17,701 |
| 10% | 10.2% | 8,809 | 9,024 |
| Active Idle | 0 | 0 | |
| Target Load | Actual Load | ssj_ops | |
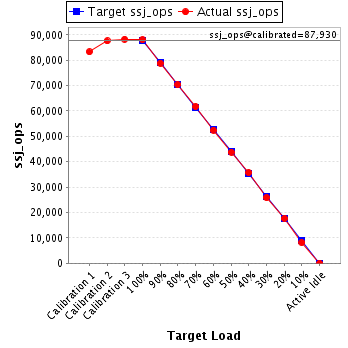
|---|---|---|---|
| Target | Actual | ||
| Calibration 1 | 83,253 | ||
| Calibration 2 | 87,574 | ||
| Calibration 3 | 88,287 | ||
| ssj_ops@calibrated=87,930 | |||
| 100% | 100.1% | 87,930 | 88,014 |
| 90% | 89.6% | 79,137 | 78,795 |
| 80% | 80.0% | 70,344 | 70,328 |
| 70% | 70.2% | 61,551 | 61,758 |
| 60% | 59.7% | 52,758 | 52,483 |
| 50% | 49.8% | 43,965 | 43,764 |
| 40% | 40.6% | 35,172 | 35,725 |
| 30% | 29.4% | 26,379 | 25,834 |
| 20% | 20.1% | 17,586 | 17,703 |
| 10% | 9.3% | 8,793 | 8,166 |
| Active Idle | 0 | 0 | |
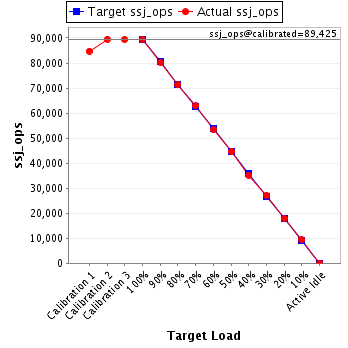
| Target Load | Actual Load | ssj_ops | |
|---|---|---|---|
| Target | Actual | ||
| Calibration 1 | 84,761 | ||
| Calibration 2 | 89,441 | ||
| Calibration 3 | 89,409 | ||
| ssj_ops@calibrated=89,425 | |||
| 100% | 100.1% | 89,425 | 89,523 |
| 90% | 89.9% | 80,482 | 80,398 |
| 80% | 79.7% | 71,540 | 71,260 |
| 70% | 70.3% | 62,597 | 62,872 |
| 60% | 59.6% | 53,655 | 53,295 |
| 50% | 49.8% | 44,712 | 44,543 |
| 40% | 39.4% | 35,770 | 35,227 |
| 30% | 30.3% | 26,827 | 27,094 |
| 20% | 19.9% | 17,885 | 17,770 |
| 10% | 10.5% | 8,942 | 9,404 |
| Active Idle | 0 | 0 | |
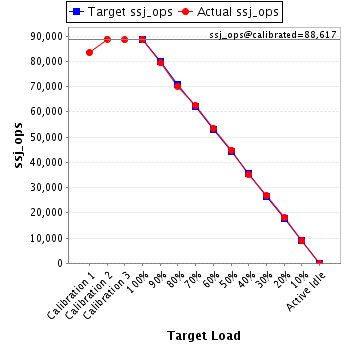
| Target Load | Actual Load | ssj_ops | |
|---|---|---|---|
| Target | Actual | ||
| Calibration 1 | 83,455 | ||
| Calibration 2 | 88,752 | ||
| Calibration 3 | 88,481 | ||
| ssj_ops@calibrated=88,617 | |||
| 100% | 99.9% | 88,617 | 88,552 |
| 90% | 89.6% | 79,755 | 79,387 |
| 80% | 79.1% | 70,893 | 70,130 |
| 70% | 70.6% | 62,032 | 62,534 |
| 60% | 60.2% | 53,170 | 53,378 |
| 50% | 50.5% | 44,308 | 44,792 |
| 40% | 39.7% | 35,447 | 35,152 |
| 30% | 30.2% | 26,585 | 26,767 |
| 20% | 20.2% | 17,723 | 17,939 |
| 10% | 10.0% | 8,862 | 8,850 |
| Active Idle | 0 | 0 | |
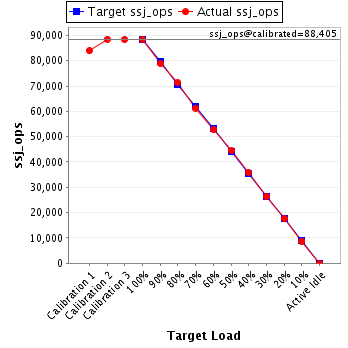
| Target Load | Actual Load | ssj_ops | |
|---|---|---|---|
| Target | Actual | ||
| Calibration 1 | 83,887 | ||
| Calibration 2 | 88,429 | ||
| Calibration 3 | 88,381 | ||
| ssj_ops@calibrated=88,405 | |||
| 100% | 100.1% | 88,405 | 88,500 |
| 90% | 89.3% | 79,565 | 78,911 |
| 80% | 80.6% | 70,724 | 71,297 |
| 70% | 69.3% | 61,884 | 61,296 |
| 60% | 59.8% | 53,043 | 52,869 |
| 50% | 50.3% | 44,203 | 44,459 |
| 40% | 40.5% | 35,362 | 35,762 |
| 30% | 29.8% | 26,522 | 26,327 |
| 20% | 19.9% | 17,681 | 17,620 |
| 10% | 9.9% | 8,841 | 8,737 |
| Active Idle | 0 | 0 | |
| Target Load | Actual Load | ssj_ops | |
|---|---|---|---|
| Target | Actual | ||
| Calibration 1 | 84,863 | ||
| Calibration 2 | 89,077 | ||
| Calibration 3 | 89,392 | ||
| ssj_ops@calibrated=89,234 | |||
| 100% | 99.5% | 89,234 | 88,782 |
| 90% | 90.3% | 80,311 | 80,582 |
| 80% | 79.9% | 71,388 | 71,282 |
| 70% | 69.8% | 62,464 | 62,253 |
| 60% | 60.5% | 53,541 | 54,002 |
| 50% | 49.8% | 44,617 | 44,459 |
| 40% | 40.1% | 35,694 | 35,777 |
| 30% | 30.3% | 26,770 | 27,038 |
| 20% | 19.6% | 17,847 | 17,524 |
| 10% | 10.1% | 8,923 | 9,053 |
| Active Idle | 0 | 0 | |

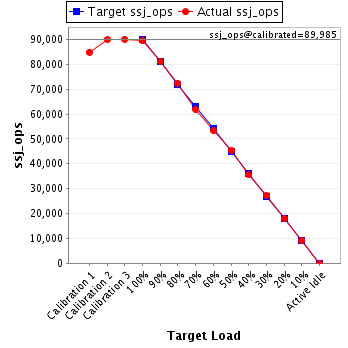
| Target Load | Actual Load | ssj_ops | |
|---|---|---|---|
| Target | Actual | ||
| Calibration 1 | 84,854 | ||
| Calibration 2 | 89,870 | ||
| Calibration 3 | 90,101 | ||
| ssj_ops@calibrated=89,985 | |||
| 100% | 99.4% | 89,985 | 89,432 |
| 90% | 90.2% | 80,987 | 81,162 |
| 80% | 80.5% | 71,988 | 72,413 |
| 70% | 68.8% | 62,990 | 61,918 |
| 60% | 59.2% | 53,991 | 53,276 |
| 50% | 50.5% | 44,993 | 45,458 |
| 40% | 39.6% | 35,994 | 35,605 |
| 30% | 30.1% | 26,996 | 27,127 |
| 20% | 19.9% | 17,997 | 17,874 |
| 10% | 10.1% | 8,999 | 9,091 |
| Active Idle | 0 | 0 | |
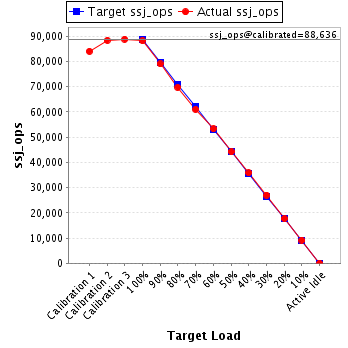
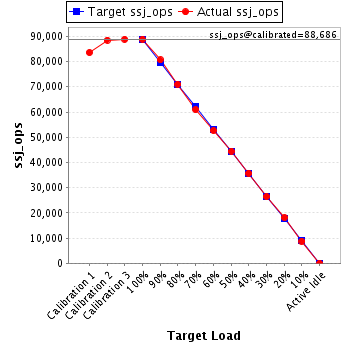
| Target Load | Actual Load | ssj_ops | |
|---|---|---|---|
| Target | Actual | ||
| Calibration 1 | 84,090 | ||
| Calibration 2 | 88,405 | ||
| Calibration 3 | 88,867 | ||
| ssj_ops@calibrated=88,636 | |||
| 100% | 99.5% | 88,636 | 88,172 |
| 90% | 89.2% | 79,773 | 79,038 |
| 80% | 78.7% | 70,909 | 69,770 |
| 70% | 68.8% | 62,046 | 61,024 |
| 60% | 60.1% | 53,182 | 53,296 |
| 50% | 49.9% | 44,318 | 44,202 |
| 40% | 40.4% | 35,455 | 35,807 |
| 30% | 30.5% | 26,591 | 27,069 |
| 20% | 20.0% | 17,727 | 17,692 |
| 10% | 10.3% | 8,864 | 9,168 |
| Active Idle | 0 | 0 | |
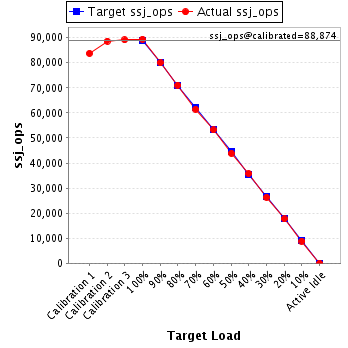
| Target Load | Actual Load | ssj_ops | |
|---|---|---|---|
| Target | Actual | ||
| Calibration 1 | 83,723 | ||
| Calibration 2 | 88,645 | ||
| Calibration 3 | 89,103 | ||
| ssj_ops@calibrated=88,874 | |||
| 100% | 100.6% | 88,874 | 89,412 |
| 90% | 90.0% | 79,987 | 80,026 |
| 80% | 79.9% | 71,099 | 71,019 |
| 70% | 69.1% | 62,212 | 61,455 |
| 60% | 59.8% | 53,324 | 53,178 |
| 50% | 49.3% | 44,437 | 43,846 |
| 40% | 40.3% | 35,550 | 35,784 |
| 30% | 29.6% | 26,662 | 26,328 |
| 20% | 19.9% | 17,775 | 17,679 |
| 10% | 9.9% | 8,887 | 8,829 |
| Active Idle | 0 | 0 | |
| Target Load | Actual Load | ssj_ops | |
|---|---|---|---|
| Target | Actual | ||
| Calibration 1 | 83,566 | ||
| Calibration 2 | 88,526 | ||
| Calibration 3 | 88,847 | ||
| ssj_ops@calibrated=88,686 | |||
| 100% | 100.2% | 88,686 | 88,891 |
| 90% | 91.0% | 79,818 | 80,699 |
| 80% | 80.1% | 70,949 | 71,028 |
| 70% | 68.7% | 62,081 | 60,911 |
| 60% | 59.4% | 53,212 | 52,657 |
| 50% | 50.1% | 44,343 | 44,433 |
| 40% | 40.2% | 35,475 | 35,684 |
| 30% | 29.8% | 26,606 | 26,441 |
| 20% | 20.4% | 17,737 | 18,095 |
| 10% | 9.9% | 8,869 | 8,753 |
| Active Idle | 0 | 0 | |
| Target Load | Actual Load | ssj_ops | |
|---|---|---|---|
| Target | Actual | ||
| Calibration 1 | 83,353 | ||
| Calibration 2 | 87,594 | ||
| Calibration 3 | 87,614 | ||
| ssj_ops@calibrated=87,604 | |||
| 100% | 99.7% | 87,604 | 87,366 |
| 90% | 89.5% | 78,844 | 78,371 |
| 80% | 79.7% | 70,083 | 69,831 |
| 70% | 70.3% | 61,323 | 61,586 |
| 60% | 60.2% | 52,562 | 52,778 |
| 50% | 50.1% | 43,802 | 43,856 |
| 40% | 39.6% | 35,042 | 34,694 |
| 30% | 29.9% | 26,281 | 26,170 |
| 20% | 19.7% | 17,521 | 17,263 |
| 10% | 10.2% | 8,760 | 8,936 |
| Active Idle | 0 | 0 | |
