SPECpower_ssj2008
Host 'M620-13' Performance Report
Copyright © 2007-2013 Standard Performance Evaluation Corporation
| Dell Inc. PowerEdge M620 (Intel Xeon E5-2670, 2.60 GHz) | ssj_ops@100% = 1,422,629 ssj_ops@100% per JVM = 88,914 |
||||
| Test Sponsor: | Dell Inc. | SPEC License #: | 55 | Test Method: | Multi Node |
| Tested By: | Dell Inc. | Test Location: | Round Rock, TX, USA | Test Date: | Jan 11, 2013 |
| Hardware Availability: | Dec-2012 | Software Availability: | Jun-2012 | Publication: | Feb 20, 2013 |
| System Source: | Single Supplier | System Designation: | Server | Power Provisioning: | Line-powered |
| Target Load | Actual Load | ssj_ops | |
|---|---|---|---|
| Target | Actual | ||
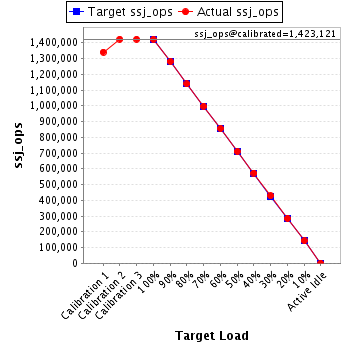
| Calibration 1 | 1,341,481 | ||
| Calibration 2 | 1,423,077 | ||
| Calibration 3 | 1,423,165 | ||
| ssj_ops@calibrated=1,423,121 | |||
| 100% | 100.0% | 1,423,121 | 1,422,629 |
| 90% | 90.1% | 1,280,809 | 1,281,617 |
| 80% | 80.0% | 1,138,497 | 1,138,829 |
| 70% | 70.2% | 996,185 | 998,351 |
| 60% | 60.2% | 853,873 | 857,024 |
| 50% | 49.9% | 711,561 | 710,434 |
| 40% | 40.3% | 569,248 | 573,082 |
| 30% | 30.1% | 426,936 | 427,971 |
| 20% | 20.0% | 284,624 | 285,117 |
| 10% | 10.0% | 142,312 | 142,659 |
| Active Idle | 0 | 0 | |
| Set Identifier: | sut |
| Set Description: | M620 |
| # of Identical Nodes: | 16 |
| Comment: | None |
| Hardware | |
|---|---|
| Hardware Vendor: | Dell Inc. |
| Model: | PowerEdge M620 (Intel Xeon E5-2670, 2.60 GHz) |
| Form Factor: | Blade |
| CPU Name: | Intel Xeon E5-2670 2.60 GHz |
| CPU Characteristics: | 8 Core, 2.60 GHz, 20MB L3 Cache |
| CPU Frequency (MHz): | 2600 |
| CPU(s) Enabled: | 16 cores, 2 chips, 8 cores/chip |
| Hardware Threads: | 32 (2 / core) |
| CPU(s) Orderable: | 1,2 chips |
| Primary Cache: | 32 KB I + 32 KB D on chip per core |
| Secondary Cache: | 256 KB I+D on chip per chip |
| Tertiary Cache: | 20 MB I+D on chip per chip |
| Other Cache: | None |
| Memory Amount (GB): | 24 |
| # and size of DIMM: | 6 x 4096 MB |
| Memory Details: | 4GB 2Rx8 PC3L-10600E-9 ECC, Slots A1-3, B1-3 populated |
| Power Supply Quantity and Rating (W): | None |
| Power Supply Details: | Shared |
| Disk Drive: | 1 x 100 GB 2.5" SATA SSD, Dell P/N: DYW42 |
| Disk Controller: | Integrated PERC S110 |
| # and type of Network Interface Cards (NICs) Installed: | 1 x Onboard Dual-Port Intel X520-k Gigabit Ethernet |
| NICs Enabled in Firmware / OS / Connected: | 2/2/1 |
| Network Speed (Mbit): | 1000 |
| Keyboard: | None |
| Mouse: | None |
| Monitor: | None |
| Optical Drives: | No |
| Other Hardware: | None |
| Software | |
|---|---|
| Power Management: | Power Saver Mode in OS (See Notes) |
| Operating System (OS): | Microsoft Windows Server 2008 Enterprise x64 Edition |
| OS Version: | R2 SP1 |
| Filesystem: | NTFS |
| JVM Vendor: | IBM Corporation |
| JVM Version: | IBM J9 VM (build 2.6, JRE 1.7.0 Windows Server 2008 R2 amd64-64 20120322_106209 (JIT enabled, AOT enabled) |
| JVM Command-line Options: | -Xaggressive -Xcompressedrefs -Xmn800m -Xms1024m -Xmx1024m -XlockReservation -Xnoloa -Xlp -Xconcurrentlevel0 -XtlhPrefetch -Xthr:minimizeusercpu -Xgcthreads4 |
| JVM Affinity: | start /affinity [3, C, 30, C0, 300, C00, 3000, C000, 30000, C0000, 300000, C00000, 3000000, C0000000, 30000000, C0000000] |
| JVM Instances: | 16 |
| JVM Initial Heap (MB): | 1024 |
| JVM Maximum Heap (MB): | 1024 |
| JVM Address Bits: | 64 |
| Boot Firmware Version: | 1.4.9 |
| Management Firmware Version: | iDRAC7 1.30.30 (Build 39) |
| Workload Version: | SSJ 1.2.10 |
| Director Location: | Controller |
| Other Software: | IBM SDK Java Technology Edition Version 7.0 for Windows x64 |
| JVM Instance | ssj_ops@100% |
|---|---|
| M620-13.001 | 88,403 |
| M620-13.002 | 89,723 |
| M620-13.003 | 88,744 |
| M620-13.004 | 89,701 |
| M620-13.005 | 89,416 |
| M620-13.006 | 89,288 |
| M620-13.007 | 88,033 |
| M620-13.008 | 88,554 |
| M620-13.009 | 89,077 |
| M620-13.010 | 89,475 |
| M620-13.011 | 88,909 |
| M620-13.012 | 88,090 |
| M620-13.013 | 88,135 |
| M620-13.014 | 89,174 |
| M620-13.015 | 88,847 |
| M620-13.016 | 89,060 |
| ssj_ops@100% | 1,422,629 |
| ssj_ops@100% per JVM | 88,914 |

| Target Load | Actual Load | ssj_ops | |
|---|---|---|---|
| Target | Actual | ||
| Calibration 1 | 83,546 | ||
| Calibration 2 | 88,389 | ||
| Calibration 3 | 88,071 | ||
| ssj_ops@calibrated=88,230 | |||
| 100% | 100.2% | 88,230 | 88,403 |
| 90% | 88.9% | 79,407 | 78,441 |
| 80% | 79.6% | 70,584 | 70,214 |
| 70% | 70.2% | 61,761 | 61,926 |
| 60% | 60.3% | 52,938 | 53,178 |
| 50% | 50.5% | 44,115 | 44,547 |
| 40% | 39.6% | 35,292 | 34,921 |
| 30% | 30.3% | 26,469 | 26,703 |
| 20% | 20.1% | 17,646 | 17,753 |
| 10% | 10.6% | 8,823 | 9,373 |
| Active Idle | 0 | 0 | |

| Target Load | Actual Load | ssj_ops | |
|---|---|---|---|
| Target | Actual | ||
| Calibration 1 | 84,389 | ||
| Calibration 2 | 89,970 | ||
| Calibration 3 | 90,044 | ||
| ssj_ops@calibrated=90,007 | |||
| 100% | 99.7% | 90,007 | 89,723 |
| 90% | 89.9% | 81,006 | 80,925 |
| 80% | 80.0% | 72,006 | 72,017 |
| 70% | 69.8% | 63,005 | 62,810 |
| 60% | 60.9% | 54,004 | 54,843 |
| 50% | 49.5% | 45,003 | 44,514 |
| 40% | 40.5% | 36,003 | 36,452 |
| 30% | 29.5% | 27,002 | 26,518 |
| 20% | 20.7% | 18,001 | 18,611 |
| 10% | 9.7% | 9,001 | 8,724 |
| Active Idle | 0 | 0 | |

| Target Load | Actual Load | ssj_ops | |
|---|---|---|---|
| Target | Actual | ||
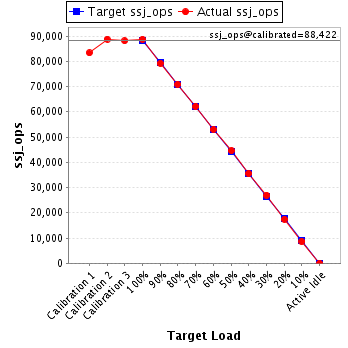
| Calibration 1 | 83,286 | ||
| Calibration 2 | 88,756 | ||
| Calibration 3 | 88,088 | ||
| ssj_ops@calibrated=88,422 | |||
| 100% | 100.4% | 88,422 | 88,744 |
| 90% | 89.6% | 79,580 | 79,191 |
| 80% | 80.1% | 70,738 | 70,834 |
| 70% | 70.3% | 61,896 | 62,181 |
| 60% | 60.0% | 53,053 | 53,033 |
| 50% | 50.4% | 44,211 | 44,587 |
| 40% | 40.2% | 35,369 | 35,505 |
| 30% | 30.5% | 26,527 | 27,000 |
| 20% | 19.7% | 17,684 | 17,446 |
| 10% | 9.8% | 8,842 | 8,633 |
| Active Idle | 0 | 0 | |
| Target Load | Actual Load | ssj_ops | |
|---|---|---|---|
| Target | Actual | ||
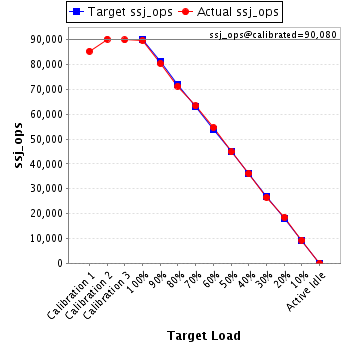
| Calibration 1 | 85,391 | ||
| Calibration 2 | 90,241 | ||
| Calibration 3 | 89,918 | ||
| ssj_ops@calibrated=90,080 | |||
| 100% | 99.6% | 90,080 | 89,701 |
| 90% | 89.3% | 81,072 | 80,420 |
| 80% | 79.2% | 72,064 | 71,316 |
| 70% | 70.3% | 63,056 | 63,352 |
| 60% | 60.6% | 54,048 | 54,624 |
| 50% | 49.8% | 45,040 | 44,848 |
| 40% | 40.1% | 36,032 | 36,115 |
| 30% | 29.4% | 27,024 | 26,526 |
| 20% | 20.6% | 18,016 | 18,519 |
| 10% | 10.3% | 9,008 | 9,287 |
| Active Idle | 0 | 0 | |
| Target Load | Actual Load | ssj_ops | |
|---|---|---|---|
| Target | Actual | ||
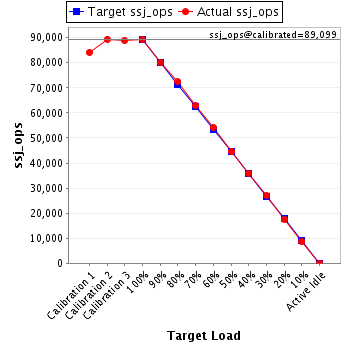
| Calibration 1 | 84,113 | ||
| Calibration 2 | 89,315 | ||
| Calibration 3 | 88,882 | ||
| ssj_ops@calibrated=89,099 | |||
| 100% | 100.4% | 89,099 | 89,416 |
| 90% | 89.9% | 80,189 | 80,086 |
| 80% | 81.2% | 71,279 | 72,360 |
| 70% | 70.7% | 62,369 | 62,981 |
| 60% | 60.8% | 53,459 | 54,207 |
| 50% | 49.9% | 44,549 | 44,504 |
| 40% | 40.3% | 35,639 | 35,934 |
| 30% | 30.3% | 26,730 | 26,973 |
| 20% | 19.8% | 17,820 | 17,625 |
| 10% | 9.7% | 8,910 | 8,661 |
| Active Idle | 0 | 0 | |
| Target Load | Actual Load | ssj_ops | |
|---|---|---|---|
| Target | Actual | ||
| Calibration 1 | 83,261 | ||
| Calibration 2 | 88,896 | ||
| Calibration 3 | 88,495 | ||
| ssj_ops@calibrated=88,696 | |||
| 100% | 100.7% | 88,696 | 89,288 |
| 90% | 90.1% | 79,826 | 79,873 |
| 80% | 79.9% | 70,957 | 70,863 |
| 70% | 70.8% | 62,087 | 62,762 |
| 60% | 60.5% | 53,217 | 53,623 |
| 50% | 50.3% | 44,348 | 44,596 |
| 40% | 40.7% | 35,478 | 36,102 |
| 30% | 29.8% | 26,609 | 26,423 |
| 20% | 19.8% | 17,739 | 17,543 |
| 10% | 10.2% | 8,870 | 9,073 |
| Active Idle | 0 | 0 | |

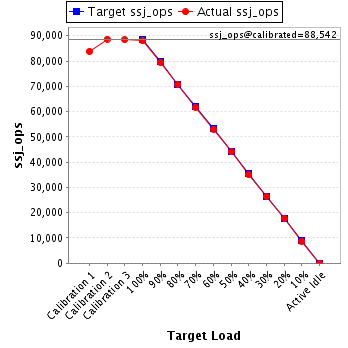
| Target Load | Actual Load | ssj_ops | |
|---|---|---|---|
| Target | Actual | ||
| Calibration 1 | 83,802 | ||
| Calibration 2 | 88,666 | ||
| Calibration 3 | 88,418 | ||
| ssj_ops@calibrated=88,542 | |||
| 100% | 99.4% | 88,542 | 88,033 |
| 90% | 89.8% | 79,688 | 79,493 |
| 80% | 80.0% | 70,834 | 70,832 |
| 70% | 69.8% | 61,979 | 61,786 |
| 60% | 59.9% | 53,125 | 53,027 |
| 50% | 49.8% | 44,271 | 44,087 |
| 40% | 39.6% | 35,417 | 35,036 |
| 30% | 29.9% | 26,563 | 26,440 |
| 20% | 20.0% | 17,708 | 17,707 |
| 10% | 9.9% | 8,854 | 8,766 |
| Active Idle | 0 | 0 | |
| Target Load | Actual Load | ssj_ops | |
|---|---|---|---|
| Target | Actual | ||
| Calibration 1 | 84,732 | ||
| Calibration 2 | 88,413 | ||
| Calibration 3 | 89,378 | ||
| ssj_ops@calibrated=88,896 | |||
| 100% | 99.6% | 88,896 | 88,554 |
| 90% | 89.1% | 80,006 | 79,227 |
| 80% | 79.6% | 71,117 | 70,766 |
| 70% | 70.4% | 62,227 | 62,582 |
| 60% | 61.2% | 53,337 | 54,428 |
| 50% | 50.8% | 44,448 | 45,141 |
| 40% | 40.2% | 35,558 | 35,774 |
| 30% | 30.8% | 26,669 | 27,401 |
| 20% | 19.9% | 17,779 | 17,716 |
| 10% | 10.0% | 8,890 | 8,845 |
| Active Idle | 0 | 0 | |

| Target Load | Actual Load | ssj_ops | |
|---|---|---|---|
| Target | Actual | ||
| Calibration 1 | 84,207 | ||
| Calibration 2 | 89,306 | ||
| Calibration 3 | 89,256 | ||
| ssj_ops@calibrated=89,281 | |||
| 100% | 99.8% | 89,281 | 89,077 |
| 90% | 90.0% | 80,353 | 80,328 |
| 80% | 80.1% | 71,425 | 71,531 |
| 70% | 70.3% | 62,497 | 62,728 |
| 60% | 60.5% | 53,569 | 53,972 |
| 50% | 49.6% | 44,641 | 44,282 |
| 40% | 40.4% | 35,713 | 36,037 |
| 30% | 30.3% | 26,784 | 27,048 |
| 20% | 20.3% | 17,856 | 18,104 |
| 10% | 9.7% | 8,928 | 8,662 |
| Active Idle | 0 | 0 | |

| Target Load | Actual Load | ssj_ops | |
|---|---|---|---|
| Target | Actual | ||
| Calibration 1 | 84,266 | ||
| Calibration 2 | 88,919 | ||
| Calibration 3 | 89,199 | ||
| ssj_ops@calibrated=89,059 | |||
| 100% | 100.5% | 89,059 | 89,475 |
| 90% | 90.6% | 80,153 | 80,707 |
| 80% | 80.1% | 71,247 | 71,333 |
| 70% | 69.6% | 62,341 | 61,997 |
| 60% | 60.3% | 53,435 | 53,692 |
| 50% | 49.7% | 44,530 | 44,245 |
| 40% | 41.0% | 35,624 | 36,488 |
| 30% | 29.8% | 26,718 | 26,563 |
| 20% | 20.5% | 17,812 | 18,230 |
| 10% | 10.1% | 8,906 | 8,987 |
| Active Idle | 0 | 0 | |

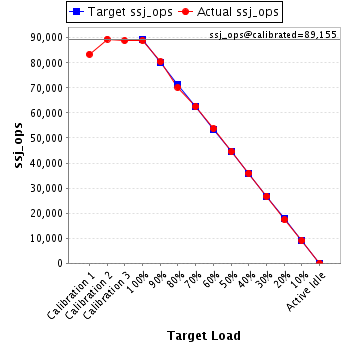
| Target Load | Actual Load | ssj_ops | |
|---|---|---|---|
| Target | Actual | ||
| Calibration 1 | 83,430 | ||
| Calibration 2 | 89,447 | ||
| Calibration 3 | 88,863 | ||
| ssj_ops@calibrated=89,155 | |||
| 100% | 99.7% | 89,155 | 88,909 |
| 90% | 90.2% | 80,240 | 80,433 |
| 80% | 78.8% | 71,324 | 70,217 |
| 70% | 70.2% | 62,409 | 62,612 |
| 60% | 60.3% | 53,493 | 53,755 |
| 50% | 50.0% | 44,578 | 44,556 |
| 40% | 40.3% | 35,662 | 35,929 |
| 30% | 30.1% | 26,747 | 26,798 |
| 20% | 19.5% | 17,831 | 17,382 |
| 10% | 10.1% | 8,916 | 9,041 |
| Active Idle | 0 | 0 | |
| Target Load | Actual Load | ssj_ops | |
|---|---|---|---|
| Target | Actual | ||
| Calibration 1 | 83,491 | ||
| Calibration 2 | 87,913 | ||
| Calibration 3 | 88,671 | ||
| ssj_ops@calibrated=88,292 | |||
| 100% | 99.8% | 88,292 | 88,090 |
| 90% | 90.6% | 79,463 | 79,966 |
| 80% | 80.1% | 70,634 | 70,727 |
| 70% | 69.9% | 61,804 | 61,759 |
| 60% | 59.9% | 52,975 | 52,915 |
| 50% | 49.6% | 44,146 | 43,798 |
| 40% | 40.2% | 35,317 | 35,469 |
| 30% | 30.4% | 26,488 | 26,863 |
| 20% | 20.4% | 17,658 | 17,983 |
| 10% | 10.0% | 8,829 | 8,866 |
| Active Idle | 0 | 0 | |

| Target Load | Actual Load | ssj_ops | |
|---|---|---|---|
| Target | Actual | ||
| Calibration 1 | 82,419 | ||
| Calibration 2 | 87,955 | ||
| Calibration 3 | 87,995 | ||
| ssj_ops@calibrated=87,975 | |||
| 100% | 100.2% | 87,975 | 88,135 |
| 90% | 90.6% | 79,178 | 79,700 |
| 80% | 78.9% | 70,380 | 69,371 |
| 70% | 70.2% | 61,583 | 61,766 |
| 60% | 59.5% | 52,785 | 52,378 |
| 50% | 49.6% | 43,988 | 43,640 |
| 40% | 40.2% | 35,190 | 35,358 |
| 30% | 30.2% | 26,393 | 26,579 |
| 20% | 20.2% | 17,595 | 17,741 |
| 10% | 10.3% | 8,798 | 9,075 |
| Active Idle | 0 | 0 | |

| Target Load | Actual Load | ssj_ops | |
|---|---|---|---|
| Target | Actual | ||
| Calibration 1 | 83,288 | ||
| Calibration 2 | 89,041 | ||
| Calibration 3 | 89,142 | ||
| ssj_ops@calibrated=89,092 | |||
| 100% | 100.1% | 89,092 | 89,174 |
| 90% | 91.3% | 80,182 | 81,342 |
| 80% | 80.5% | 71,273 | 71,744 |
| 70% | 70.2% | 62,364 | 62,548 |
| 60% | 59.4% | 53,455 | 52,932 |
| 50% | 50.3% | 44,546 | 44,790 |
| 40% | 40.6% | 35,637 | 36,209 |
| 30% | 29.7% | 26,727 | 26,450 |
| 20% | 19.7% | 17,818 | 17,532 |
| 10% | 9.7% | 8,909 | 8,612 |
| Active Idle | 0 | 0 | |

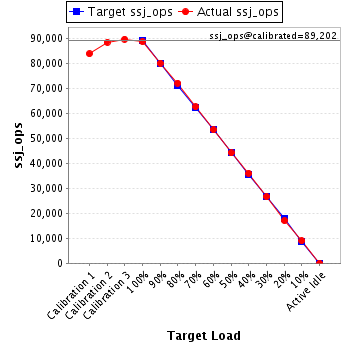
| Target Load | Actual Load | ssj_ops | |
|---|---|---|---|
| Target | Actual | ||
| Calibration 1 | 83,932 | ||
| Calibration 2 | 88,554 | ||
| Calibration 3 | 89,851 | ||
| ssj_ops@calibrated=89,202 | |||
| 100% | 99.6% | 89,202 | 88,847 |
| 90% | 89.9% | 80,282 | 80,224 |
| 80% | 81.0% | 71,362 | 72,241 |
| 70% | 70.3% | 62,442 | 62,679 |
| 60% | 60.0% | 53,521 | 53,523 |
| 50% | 49.6% | 44,601 | 44,281 |
| 40% | 40.5% | 35,681 | 36,086 |
| 30% | 29.9% | 26,761 | 26,682 |
| 20% | 19.2% | 17,840 | 17,118 |
| 10% | 10.1% | 8,920 | 9,046 |
| Active Idle | 0 | 0 | |
| Target Load | Actual Load | ssj_ops | |
|---|---|---|---|
| Target | Actual | ||
| Calibration 1 | 83,928 | ||
| Calibration 2 | 89,294 | ||
| Calibration 3 | 88,893 | ||
| ssj_ops@calibrated=89,093 | |||
| 100% | 100.0% | 89,093 | 89,060 |
| 90% | 91.2% | 80,184 | 81,260 |
| 80% | 81.3% | 71,275 | 72,463 |
| 70% | 69.5% | 62,365 | 61,884 |
| 60% | 59.4% | 53,456 | 52,893 |
| 50% | 49.4% | 44,547 | 44,018 |
| 40% | 40.0% | 35,637 | 35,667 |
| 30% | 30.3% | 26,728 | 27,004 |
| 20% | 20.3% | 17,819 | 18,106 |
| 10% | 10.1% | 8,909 | 9,008 |
| Active Idle | 0 | 0 | |
