SPECpower_ssj2008
Host 'M620-14' Performance Report
Copyright © 2007-2013 Standard Performance Evaluation Corporation
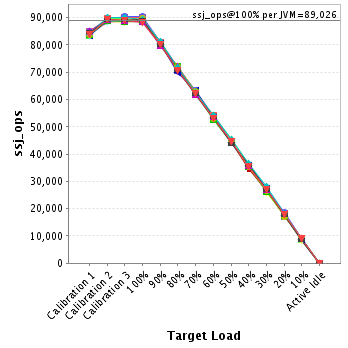
| Dell Inc. PowerEdge M620 (Intel Xeon E5-2670, 2.60 GHz) | ssj_ops@100% = 1,424,412 ssj_ops@100% per JVM = 89,026 |
||||
| Test Sponsor: | Dell Inc. | SPEC License #: | 55 | Test Method: | Multi Node |
| Tested By: | Dell Inc. | Test Location: | Round Rock, TX, USA | Test Date: | Jan 11, 2013 |
| Hardware Availability: | Dec-2012 | Software Availability: | Jun-2012 | Publication: | Feb 20, 2013 |
| System Source: | Single Supplier | System Designation: | Server | Power Provisioning: | Line-powered |
| Target Load | Actual Load | ssj_ops | |
|---|---|---|---|
| Target | Actual | ||
| Calibration 1 | 1,346,824 | ||
| Calibration 2 | 1,425,441 | ||
| Calibration 3 | 1,427,440 | ||
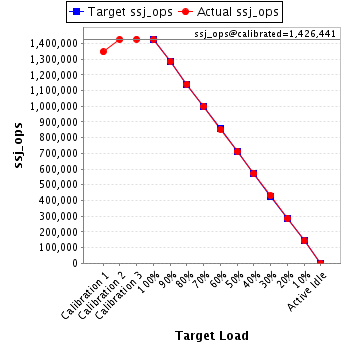
| ssj_ops@calibrated=1,426,441 | |||
| 100% | 99.9% | 1,426,441 | 1,424,412 |
| 90% | 90.0% | 1,283,797 | 1,284,006 |
| 80% | 80.0% | 1,141,152 | 1,141,140 |
| 70% | 70.1% | 998,508 | 999,763 |
| 60% | 59.9% | 855,864 | 854,006 |
| 50% | 49.9% | 713,220 | 711,950 |
| 40% | 40.0% | 570,576 | 570,669 |
| 30% | 30.1% | 427,932 | 429,879 |
| 20% | 20.0% | 285,288 | 285,438 |
| 10% | 10.0% | 142,644 | 142,493 |
| Active Idle | 0 | 0 | |
| Set Identifier: | sut |
| Set Description: | M620 |
| # of Identical Nodes: | 16 |
| Comment: | None |
| Hardware | |
|---|---|
| Hardware Vendor: | Dell Inc. |
| Model: | PowerEdge M620 (Intel Xeon E5-2670, 2.60 GHz) |
| Form Factor: | Blade |
| CPU Name: | Intel Xeon E5-2670 2.60 GHz |
| CPU Characteristics: | 8 Core, 2.60 GHz, 20MB L3 Cache |
| CPU Frequency (MHz): | 2600 |
| CPU(s) Enabled: | 16 cores, 2 chips, 8 cores/chip |
| Hardware Threads: | 32 (2 / core) |
| CPU(s) Orderable: | 1,2 chips |
| Primary Cache: | 32 KB I + 32 KB D on chip per core |
| Secondary Cache: | 256 KB I+D on chip per chip |
| Tertiary Cache: | 20 MB I+D on chip per chip |
| Other Cache: | None |
| Memory Amount (GB): | 24 |
| # and size of DIMM: | 6 x 4096 MB |
| Memory Details: | 4GB 2Rx8 PC3L-10600E-9 ECC, Slots A1-3, B1-3 populated |
| Power Supply Quantity and Rating (W): | None |
| Power Supply Details: | Shared |
| Disk Drive: | 1 x 100 GB 2.5" SATA SSD, Dell P/N: DYW42 |
| Disk Controller: | Integrated PERC S110 |
| # and type of Network Interface Cards (NICs) Installed: | 1 x Onboard Dual-Port Intel X520-k Gigabit Ethernet |
| NICs Enabled in Firmware / OS / Connected: | 2/2/1 |
| Network Speed (Mbit): | 1000 |
| Keyboard: | None |
| Mouse: | None |
| Monitor: | None |
| Optical Drives: | No |
| Other Hardware: | None |
| Software | |
|---|---|
| Power Management: | Power Saver Mode in OS (See Notes) |
| Operating System (OS): | Microsoft Windows Server 2008 Enterprise x64 Edition |
| OS Version: | R2 SP1 |
| Filesystem: | NTFS |
| JVM Vendor: | IBM Corporation |
| JVM Version: | IBM J9 VM (build 2.6, JRE 1.7.0 Windows Server 2008 R2 amd64-64 20120322_106209 (JIT enabled, AOT enabled) |
| JVM Command-line Options: | -Xaggressive -Xcompressedrefs -Xmn800m -Xms1024m -Xmx1024m -XlockReservation -Xnoloa -Xlp -Xconcurrentlevel0 -XtlhPrefetch -Xthr:minimizeusercpu -Xgcthreads4 |
| JVM Affinity: | start /affinity [3, C, 30, C0, 300, C00, 3000, C000, 30000, C0000, 300000, C00000, 3000000, C0000000, 30000000, C0000000] |
| JVM Instances: | 16 |
| JVM Initial Heap (MB): | 1024 |
| JVM Maximum Heap (MB): | 1024 |
| JVM Address Bits: | 64 |
| Boot Firmware Version: | 1.4.9 |
| Management Firmware Version: | iDRAC7 1.30.30 (Build 39) |
| Workload Version: | SSJ 1.2.10 |
| Director Location: | Controller |
| Other Software: | IBM SDK Java Technology Edition Version 7.0 for Windows x64 |
| JVM Instance | ssj_ops@100% |
|---|---|
| M620-14.001 | 90,087 |
| M620-14.002 | 90,309 |
| M620-14.003 | 89,102 |
| M620-14.004 | 88,451 |
| M620-14.005 | 89,275 |
| M620-14.006 | 88,107 |
| M620-14.007 | 88,276 |
| M620-14.008 | 88,818 |
| M620-14.009 | 89,395 |
| M620-14.010 | 88,831 |
| M620-14.011 | 88,691 |
| M620-14.012 | 89,860 |
| M620-14.013 | 88,494 |
| M620-14.014 | 89,294 |
| M620-14.015 | 89,187 |
| M620-14.016 | 88,234 |
| ssj_ops@100% | 1,424,412 |
| ssj_ops@100% per JVM | 89,026 |
| Target Load | Actual Load | ssj_ops | |
|---|---|---|---|
| Target | Actual | ||
| Calibration 1 | 84,753 | ||
| Calibration 2 | 89,866 | ||
| Calibration 3 | 89,999 | ||
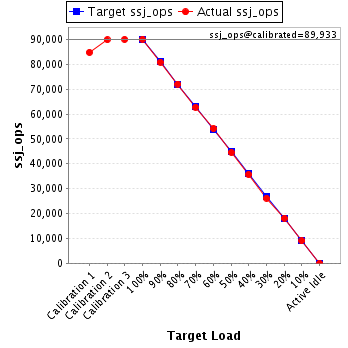
| ssj_ops@calibrated=89,933 | |||
| 100% | 100.2% | 89,933 | 90,087 |
| 90% | 89.9% | 80,939 | 80,873 |
| 80% | 80.1% | 71,946 | 72,045 |
| 70% | 69.8% | 62,953 | 62,791 |
| 60% | 60.2% | 53,960 | 54,141 |
| 50% | 49.5% | 44,966 | 44,537 |
| 40% | 39.7% | 35,973 | 35,682 |
| 30% | 29.1% | 26,980 | 26,173 |
| 20% | 20.2% | 17,987 | 18,168 |
| 10% | 10.0% | 8,993 | 9,033 |
| Active Idle | 0 | 0 | |
| Target Load | Actual Load | ssj_ops | |
|---|---|---|---|
| Target | Actual | ||
| Calibration 1 | 85,070 | ||
| Calibration 2 | 89,506 | ||
| Calibration 3 | 90,484 | ||
| ssj_ops@calibrated=89,995 | |||
| 100% | 100.3% | 89,995 | 90,309 |
| 90% | 90.0% | 80,995 | 81,014 |
| 80% | 79.7% | 71,996 | 71,741 |
| 70% | 70.4% | 62,996 | 63,393 |
| 60% | 59.7% | 53,997 | 53,714 |
| 50% | 49.4% | 44,997 | 44,467 |
| 40% | 39.9% | 35,998 | 35,907 |
| 30% | 29.8% | 26,998 | 26,775 |
| 20% | 20.5% | 17,999 | 18,426 |
| 10% | 10.2% | 8,999 | 9,216 |
| Active Idle | 0 | 0 | |

| Target Load | Actual Load | ssj_ops | |
|---|---|---|---|
| Target | Actual | ||
| Calibration 1 | 83,592 | ||
| Calibration 2 | 89,701 | ||
| Calibration 3 | 89,711 | ||
| ssj_ops@calibrated=89,706 | |||
| 100% | 99.3% | 89,706 | 89,102 |
| 90% | 90.3% | 80,736 | 80,996 |
| 80% | 79.7% | 71,765 | 71,534 |
| 70% | 69.7% | 62,794 | 62,509 |
| 60% | 60.2% | 53,824 | 54,036 |
| 50% | 50.7% | 44,853 | 45,470 |
| 40% | 40.7% | 35,883 | 36,485 |
| 30% | 30.3% | 26,912 | 27,157 |
| 20% | 20.0% | 17,941 | 17,936 |
| 10% | 9.8% | 8,971 | 8,804 |
| Active Idle | 0 | 0 | |

| Target Load | Actual Load | ssj_ops | |
|---|---|---|---|
| Target | Actual | ||
| Calibration 1 | 84,268 | ||
| Calibration 2 | 88,530 | ||
| Calibration 3 | 88,375 | ||
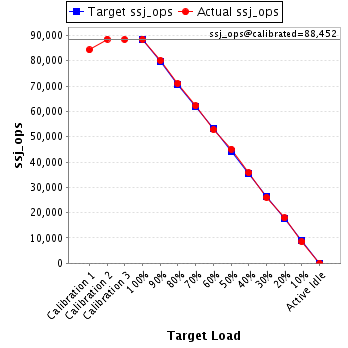
| ssj_ops@calibrated=88,452 | |||
| 100% | 100.0% | 88,452 | 88,451 |
| 90% | 90.6% | 79,607 | 80,096 |
| 80% | 80.3% | 70,762 | 71,030 |
| 70% | 70.3% | 61,917 | 62,164 |
| 60% | 59.7% | 53,071 | 52,778 |
| 50% | 51.0% | 44,226 | 45,081 |
| 40% | 40.4% | 35,381 | 35,742 |
| 30% | 29.4% | 26,536 | 26,027 |
| 20% | 20.3% | 17,690 | 17,912 |
| 10% | 9.6% | 8,845 | 8,516 |
| Active Idle | 0 | 0 | |
| Target Load | Actual Load | ssj_ops | |
|---|---|---|---|
| Target | Actual | ||
| Calibration 1 | 84,635 | ||
| Calibration 2 | 88,675 | ||
| Calibration 3 | 89,349 | ||
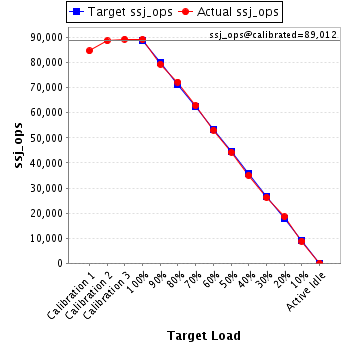
| ssj_ops@calibrated=89,012 | |||
| 100% | 100.3% | 89,012 | 89,275 |
| 90% | 89.1% | 80,111 | 79,325 |
| 80% | 81.2% | 71,210 | 72,260 |
| 70% | 70.7% | 62,308 | 62,921 |
| 60% | 59.7% | 53,407 | 53,131 |
| 50% | 49.7% | 44,506 | 44,252 |
| 40% | 39.4% | 35,605 | 35,034 |
| 30% | 29.5% | 26,704 | 26,292 |
| 20% | 20.8% | 17,802 | 18,541 |
| 10% | 9.9% | 8,901 | 8,787 |
| Active Idle | 0 | 0 | |
| Target Load | Actual Load | ssj_ops | |
|---|---|---|---|
| Target | Actual | ||
| Calibration 1 | 83,586 | ||
| Calibration 2 | 88,447 | ||
| Calibration 3 | 88,588 | ||
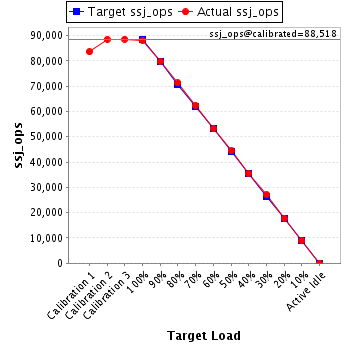
| ssj_ops@calibrated=88,518 | |||
| 100% | 99.5% | 88,518 | 88,107 |
| 90% | 90.1% | 79,666 | 79,741 |
| 80% | 80.5% | 70,814 | 71,267 |
| 70% | 70.5% | 61,962 | 62,382 |
| 60% | 60.0% | 53,111 | 53,143 |
| 50% | 50.2% | 44,259 | 44,437 |
| 40% | 40.1% | 35,407 | 35,516 |
| 30% | 30.6% | 26,555 | 27,078 |
| 20% | 20.2% | 17,704 | 17,845 |
| 10% | 10.2% | 8,852 | 9,000 |
| Active Idle | 0 | 0 | |
| Target Load | Actual Load | ssj_ops | |
|---|---|---|---|
| Target | Actual | ||
| Calibration 1 | 83,843 | ||
| Calibration 2 | 88,335 | ||
| Calibration 3 | 88,611 | ||
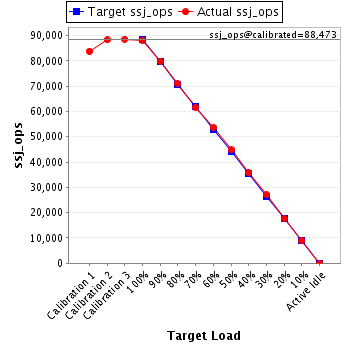
| ssj_ops@calibrated=88,473 | |||
| 100% | 99.8% | 88,473 | 88,276 |
| 90% | 90.4% | 79,625 | 79,975 |
| 80% | 80.3% | 70,778 | 71,036 |
| 70% | 69.8% | 61,931 | 61,761 |
| 60% | 60.6% | 53,084 | 53,617 |
| 50% | 50.6% | 44,236 | 44,799 |
| 40% | 40.4% | 35,389 | 35,752 |
| 30% | 30.6% | 26,542 | 27,053 |
| 20% | 19.9% | 17,695 | 17,586 |
| 10% | 10.0% | 8,847 | 8,850 |
| Active Idle | 0 | 0 | |
| Target Load | Actual Load | ssj_ops | |
|---|---|---|---|
| Target | Actual | ||
| Calibration 1 | 84,073 | ||
| Calibration 2 | 88,584 | ||
| Calibration 3 | 89,116 | ||
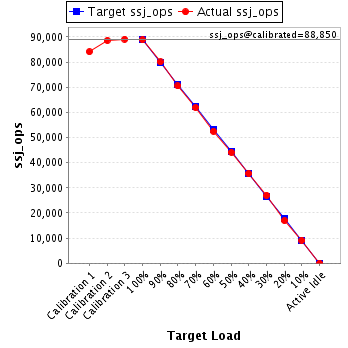
| ssj_ops@calibrated=88,850 | |||
| 100% | 100.0% | 88,850 | 88,818 |
| 90% | 90.1% | 79,965 | 80,039 |
| 80% | 79.3% | 71,080 | 70,494 |
| 70% | 69.7% | 62,195 | 61,917 |
| 60% | 59.1% | 53,310 | 52,500 |
| 50% | 49.6% | 44,425 | 44,079 |
| 40% | 40.1% | 35,540 | 35,666 |
| 30% | 30.4% | 26,655 | 27,030 |
| 20% | 19.1% | 17,770 | 16,966 |
| 10% | 10.2% | 8,885 | 9,095 |
| Active Idle | 0 | 0 | |
| Target Load | Actual Load | ssj_ops | |
|---|---|---|---|
| Target | Actual | ||
| Calibration 1 | 84,082 | ||
| Calibration 2 | 88,950 | ||
| Calibration 3 | 89,001 | ||
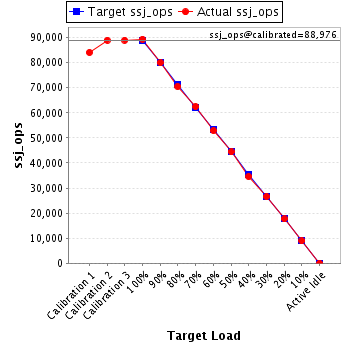
| ssj_ops@calibrated=88,976 | |||
| 100% | 100.5% | 88,976 | 89,395 |
| 90% | 89.9% | 80,078 | 80,018 |
| 80% | 79.3% | 71,181 | 70,537 |
| 70% | 70.2% | 62,283 | 62,479 |
| 60% | 59.5% | 53,385 | 52,920 |
| 50% | 49.9% | 44,488 | 44,433 |
| 40% | 38.9% | 35,590 | 34,612 |
| 30% | 29.9% | 26,693 | 26,640 |
| 20% | 19.8% | 17,795 | 17,657 |
| 10% | 10.1% | 8,898 | 8,954 |
| Active Idle | 0 | 0 | |
| Target Load | Actual Load | ssj_ops | |
|---|---|---|---|
| Target | Actual | ||
| Calibration 1 | 83,436 | ||
| Calibration 2 | 88,783 | ||
| Calibration 3 | 88,932 | ||
| ssj_ops@calibrated=88,858 | |||
| 100% | 100.0% | 88,858 | 88,831 |
| 90% | 90.5% | 79,972 | 80,441 |
| 80% | 78.8% | 71,086 | 70,011 |
| 70% | 71.1% | 62,200 | 63,148 |
| 60% | 60.2% | 53,315 | 53,458 |
| 50% | 49.7% | 44,429 | 44,146 |
| 40% | 40.2% | 35,543 | 35,690 |
| 30% | 30.9% | 26,657 | 27,426 |
| 20% | 19.6% | 17,772 | 17,434 |
| 10% | 9.9% | 8,886 | 8,815 |
| Active Idle | 0 | 0 | |

| Target Load | Actual Load | ssj_ops | |
|---|---|---|---|
| Target | Actual | ||
| Calibration 1 | 83,941 | ||
| Calibration 2 | 88,989 | ||
| Calibration 3 | 88,637 | ||
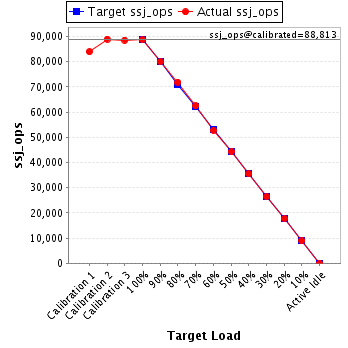
| ssj_ops@calibrated=88,813 | |||
| 100% | 99.9% | 88,813 | 88,691 |
| 90% | 90.1% | 79,932 | 80,011 |
| 80% | 81.0% | 71,050 | 71,946 |
| 70% | 70.4% | 62,169 | 62,524 |
| 60% | 59.4% | 53,288 | 52,772 |
| 50% | 49.9% | 44,406 | 44,287 |
| 40% | 39.9% | 35,525 | 35,468 |
| 30% | 29.7% | 26,644 | 26,411 |
| 20% | 19.9% | 17,763 | 17,662 |
| 10% | 10.1% | 8,881 | 8,937 |
| Active Idle | 0 | 0 | |
| Target Load | Actual Load | ssj_ops | |
|---|---|---|---|
| Target | Actual | ||
| Calibration 1 | 83,806 | ||
| Calibration 2 | 89,443 | ||
| Calibration 3 | 89,224 | ||
| ssj_ops@calibrated=89,333 | |||
| 100% | 100.6% | 89,333 | 89,860 |
| 90% | 89.6% | 80,400 | 80,016 |
| 80% | 80.5% | 71,467 | 71,934 |
| 70% | 70.4% | 62,533 | 62,859 |
| 60% | 59.5% | 53,600 | 53,191 |
| 50% | 49.6% | 44,667 | 44,320 |
| 40% | 39.6% | 35,733 | 35,409 |
| 30% | 29.8% | 26,800 | 26,604 |
| 20% | 19.3% | 17,867 | 17,215 |
| 10% | 10.1% | 8,933 | 9,020 |
| Active Idle | 0 | 0 | |

| Target Load | Actual Load | ssj_ops | |
|---|---|---|---|
| Target | Actual | ||
| Calibration 1 | 84,972 | ||
| Calibration 2 | 89,256 | ||
| Calibration 3 | 89,119 | ||
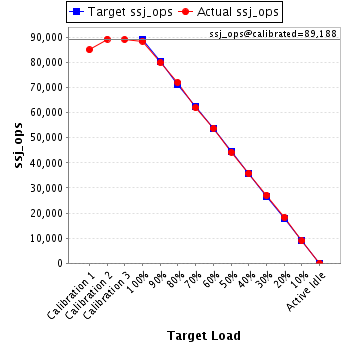
| ssj_ops@calibrated=89,188 | |||
| 100% | 99.2% | 89,188 | 88,494 |
| 90% | 89.6% | 80,269 | 79,902 |
| 80% | 80.7% | 71,350 | 71,995 |
| 70% | 69.5% | 62,431 | 61,944 |
| 60% | 60.3% | 53,513 | 53,753 |
| 50% | 49.6% | 44,594 | 44,229 |
| 40% | 40.1% | 35,675 | 35,798 |
| 30% | 30.4% | 26,756 | 27,131 |
| 20% | 20.5% | 17,838 | 18,315 |
| 10% | 10.0% | 8,919 | 8,923 |
| Active Idle | 0 | 0 | |
| Target Load | Actual Load | ssj_ops | |
|---|---|---|---|
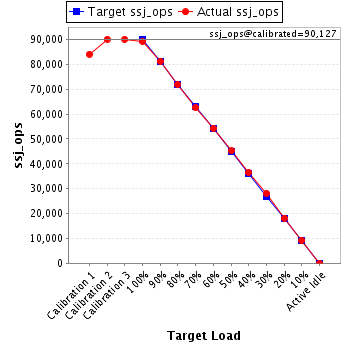
| Target | Actual | ||
| Calibration 1 | 84,126 | ||
| Calibration 2 | 90,099 | ||
| Calibration 3 | 90,155 | ||
| ssj_ops@calibrated=90,127 | |||
| 100% | 99.1% | 90,127 | 89,294 |
| 90% | 90.3% | 81,114 | 81,340 |
| 80% | 79.8% | 72,102 | 71,910 |
| 70% | 69.5% | 63,089 | 62,670 |
| 60% | 60.3% | 54,076 | 54,327 |
| 50% | 50.1% | 45,063 | 45,176 |
| 40% | 40.5% | 36,051 | 36,515 |
| 30% | 31.2% | 27,038 | 28,120 |
| 20% | 20.2% | 18,025 | 18,204 |
| 10% | 10.2% | 9,013 | 9,194 |
| Active Idle | 0 | 0 | |
| Target Load | Actual Load | ssj_ops | |
|---|---|---|---|
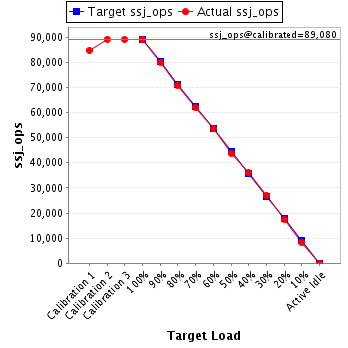
| Target | Actual | ||
| Calibration 1 | 84,705 | ||
| Calibration 2 | 89,094 | ||
| Calibration 3 | 89,066 | ||
| ssj_ops@calibrated=89,080 | |||
| 100% | 100.1% | 89,080 | 89,187 |
| 90% | 89.7% | 80,172 | 79,920 |
| 80% | 79.6% | 71,264 | 70,914 |
| 70% | 69.6% | 62,356 | 62,009 |
| 60% | 60.1% | 53,448 | 53,502 |
| 50% | 49.2% | 44,540 | 43,785 |
| 40% | 40.5% | 35,632 | 36,117 |
| 30% | 30.1% | 26,724 | 26,851 |
| 20% | 19.7% | 17,816 | 17,545 |
| 10% | 9.4% | 8,908 | 8,412 |
| Active Idle | 0 | 0 | |
| Target Load | Actual Load | ssj_ops | |
|---|---|---|---|
| Target | Actual | ||
| Calibration 1 | 83,938 | ||
| Calibration 2 | 89,183 | ||
| Calibration 3 | 89,074 | ||
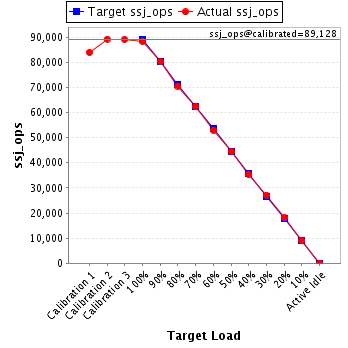
| ssj_ops@calibrated=89,128 | |||
| 100% | 99.0% | 89,128 | 88,234 |
| 90% | 90.1% | 80,216 | 80,301 |
| 80% | 79.1% | 71,303 | 70,486 |
| 70% | 69.9% | 62,390 | 62,292 |
| 60% | 59.5% | 53,477 | 53,022 |
| 50% | 49.9% | 44,564 | 44,451 |
| 40% | 39.6% | 35,651 | 35,277 |
| 30% | 30.4% | 26,739 | 27,111 |
| 20% | 20.2% | 17,826 | 18,026 |
| 10% | 10.0% | 8,913 | 8,937 |
| Active Idle | 0 | 0 | |