SPECpower_ssj2008
Host 'M620-15' Performance Report
Copyright © 2007-2013 Standard Performance Evaluation Corporation
| Dell Inc. PowerEdge M620 (Intel Xeon E5-2670, 2.60 GHz) | ssj_ops@100% = 1,425,583 ssj_ops@100% per JVM = 89,099 |
||||
| Test Sponsor: | Dell Inc. | SPEC License #: | 55 | Test Method: | Multi Node |
| Tested By: | Dell Inc. | Test Location: | Round Rock, TX, USA | Test Date: | Jan 11, 2013 |
| Hardware Availability: | Dec-2012 | Software Availability: | Jun-2012 | Publication: | Feb 20, 2013 |
| System Source: | Single Supplier | System Designation: | Server | Power Provisioning: | Line-powered |
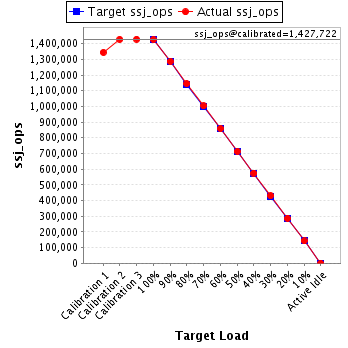
| Target Load | Actual Load | ssj_ops | |
|---|---|---|---|
| Target | Actual | ||
| Calibration 1 | 1,344,483 | ||
| Calibration 2 | 1,426,927 | ||
| Calibration 3 | 1,428,517 | ||
| ssj_ops@calibrated=1,427,722 | |||
| 100% | 99.9% | 1,427,722 | 1,425,583 |
| 90% | 90.2% | 1,284,950 | 1,287,205 |
| 80% | 80.2% | 1,142,178 | 1,145,282 |
| 70% | 70.2% | 999,405 | 1,002,654 |
| 60% | 60.1% | 856,633 | 858,657 |
| 50% | 49.9% | 713,861 | 712,965 |
| 40% | 40.2% | 571,089 | 574,400 |
| 30% | 30.1% | 428,317 | 429,168 |
| 20% | 20.1% | 285,544 | 287,248 |
| 10% | 10.0% | 142,772 | 142,210 |
| Active Idle | 0 | 0 | |
| Set Identifier: | sut |
| Set Description: | M620 |
| # of Identical Nodes: | 16 |
| Comment: | None |
| Hardware | |
|---|---|
| Hardware Vendor: | Dell Inc. |
| Model: | PowerEdge M620 (Intel Xeon E5-2670, 2.60 GHz) |
| Form Factor: | Blade |
| CPU Name: | Intel Xeon E5-2670 2.60 GHz |
| CPU Characteristics: | 8 Core, 2.60 GHz, 20MB L3 Cache |
| CPU Frequency (MHz): | 2600 |
| CPU(s) Enabled: | 16 cores, 2 chips, 8 cores/chip |
| Hardware Threads: | 32 (2 / core) |
| CPU(s) Orderable: | 1,2 chips |
| Primary Cache: | 32 KB I + 32 KB D on chip per core |
| Secondary Cache: | 256 KB I+D on chip per chip |
| Tertiary Cache: | 20 MB I+D on chip per chip |
| Other Cache: | None |
| Memory Amount (GB): | 24 |
| # and size of DIMM: | 6 x 4096 MB |
| Memory Details: | 4GB 2Rx8 PC3L-10600E-9 ECC, Slots A1-3, B1-3 populated |
| Power Supply Quantity and Rating (W): | None |
| Power Supply Details: | Shared |
| Disk Drive: | 1 x 100 GB 2.5" SATA SSD, Dell P/N: DYW42 |
| Disk Controller: | Integrated PERC S110 |
| # and type of Network Interface Cards (NICs) Installed: | 1 x Onboard Dual-Port Intel X520-k Gigabit Ethernet |
| NICs Enabled in Firmware / OS / Connected: | 2/2/1 |
| Network Speed (Mbit): | 1000 |
| Keyboard: | None |
| Mouse: | None |
| Monitor: | None |
| Optical Drives: | No |
| Other Hardware: | None |
| Software | |
|---|---|
| Power Management: | Power Saver Mode in OS (See Notes) |
| Operating System (OS): | Microsoft Windows Server 2008 Enterprise x64 Edition |
| OS Version: | R2 SP1 |
| Filesystem: | NTFS |
| JVM Vendor: | IBM Corporation |
| JVM Version: | IBM J9 VM (build 2.6, JRE 1.7.0 Windows Server 2008 R2 amd64-64 20120322_106209 (JIT enabled, AOT enabled) |
| JVM Command-line Options: | -Xaggressive -Xcompressedrefs -Xmn800m -Xms1024m -Xmx1024m -XlockReservation -Xnoloa -Xlp -Xconcurrentlevel0 -XtlhPrefetch -Xthr:minimizeusercpu -Xgcthreads4 |
| JVM Affinity: | start /affinity [3, C, 30, C0, 300, C00, 3000, C000, 30000, C0000, 300000, C00000, 3000000, C0000000, 30000000, C0000000] |
| JVM Instances: | 16 |
| JVM Initial Heap (MB): | 1024 |
| JVM Maximum Heap (MB): | 1024 |
| JVM Address Bits: | 64 |
| Boot Firmware Version: | 1.4.9 |
| Management Firmware Version: | iDRAC7 1.30.30 (Build 39) |
| Workload Version: | SSJ 1.2.10 |
| Director Location: | Controller |
| Other Software: | IBM SDK Java Technology Edition Version 7.0 for Windows x64 |
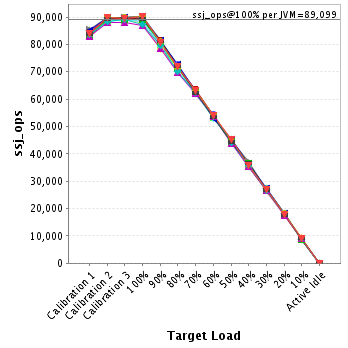
| JVM Instance | ssj_ops@100% |
|---|---|
| M620-15.001 | 89,424 |
| M620-15.002 | 90,084 |
| M620-15.003 | 89,086 |
| M620-15.004 | 87,759 |
| M620-15.005 | 88,277 |
| M620-15.006 | 88,232 |
| M620-15.007 | 89,552 |
| M620-15.008 | 90,136 |
| M620-15.009 | 89,448 |
| M620-15.010 | 90,118 |
| M620-15.011 | 89,220 |
| M620-15.012 | 90,281 |
| M620-15.013 | 87,012 |
| M620-15.014 | 87,419 |
| M620-15.015 | 89,420 |
| M620-15.016 | 90,114 |
| ssj_ops@100% | 1,425,583 |
| ssj_ops@100% per JVM | 89,099 |
| Target Load | Actual Load | ssj_ops | |
|---|---|---|---|
| Target | Actual | ||
| Calibration 1 | 84,002 | ||
| Calibration 2 | 88,893 | ||
| Calibration 3 | 89,118 | ||
| ssj_ops@calibrated=89,006 | |||
| 100% | 100.5% | 89,006 | 89,424 |
| 90% | 90.9% | 80,105 | 80,904 |
| 80% | 81.2% | 71,205 | 72,301 |
| 70% | 70.2% | 62,304 | 62,491 |
| 60% | 60.0% | 53,403 | 53,392 |
| 50% | 50.2% | 44,503 | 44,675 |
| 40% | 39.6% | 35,602 | 35,266 |
| 30% | 29.8% | 26,702 | 26,554 |
| 20% | 19.7% | 17,801 | 17,561 |
| 10% | 9.8% | 8,901 | 8,762 |
| Active Idle | 0 | 0 | |
| Target Load | Actual Load | ssj_ops | |
|---|---|---|---|
| Target | Actual | ||
| Calibration 1 | 83,900 | ||
| Calibration 2 | 89,433 | ||
| Calibration 3 | 89,688 | ||
| ssj_ops@calibrated=89,560 | |||
| 100% | 100.6% | 89,560 | 90,084 |
| 90% | 90.3% | 80,604 | 80,915 |
| 80% | 81.0% | 71,648 | 72,526 |
| 70% | 69.9% | 62,692 | 62,571 |
| 60% | 60.7% | 53,736 | 54,377 |
| 50% | 49.3% | 44,780 | 44,120 |
| 40% | 39.3% | 35,824 | 35,211 |
| 30% | 30.5% | 26,868 | 27,294 |
| 20% | 20.5% | 17,912 | 18,357 |
| 10% | 9.7% | 8,956 | 8,658 |
| Active Idle | 0 | 0 | |
| Target Load | Actual Load | ssj_ops | |
|---|---|---|---|
| Target | Actual | ||
| Calibration 1 | 84,937 | ||
| Calibration 2 | 88,841 | ||
| Calibration 3 | 88,804 | ||
| ssj_ops@calibrated=88,823 | |||
| 100% | 100.3% | 88,823 | 89,086 |
| 90% | 89.8% | 79,940 | 79,791 |
| 80% | 80.3% | 71,058 | 71,341 |
| 70% | 70.5% | 62,176 | 62,620 |
| 60% | 60.0% | 53,294 | 53,285 |
| 50% | 50.8% | 44,411 | 45,159 |
| 40% | 40.0% | 35,529 | 35,536 |
| 30% | 30.7% | 26,647 | 27,257 |
| 20% | 20.2% | 17,765 | 17,921 |
| 10% | 9.8% | 8,882 | 8,670 |
| Active Idle | 0 | 0 | |
| Target Load | Actual Load | ssj_ops | |
|---|---|---|---|
| Target | Actual | ||
| Calibration 1 | 83,816 | ||
| Calibration 2 | 88,745 | ||
| Calibration 3 | 89,069 | ||
| ssj_ops@calibrated=88,907 | |||
| 100% | 98.7% | 88,907 | 87,759 |
| 90% | 88.1% | 80,016 | 78,333 |
| 80% | 80.4% | 71,126 | 71,488 |
| 70% | 71.0% | 62,235 | 63,094 |
| 60% | 60.3% | 53,344 | 53,581 |
| 50% | 50.0% | 44,454 | 44,466 |
| 40% | 40.1% | 35,563 | 35,624 |
| 30% | 30.5% | 26,672 | 27,087 |
| 20% | 20.2% | 17,781 | 17,965 |
| 10% | 10.6% | 8,891 | 9,437 |
| Active Idle | 0 | 0 | |
| Target Load | Actual Load | ssj_ops | |
|---|---|---|---|
| Target | Actual | ||
| Calibration 1 | 85,011 | ||
| Calibration 2 | 89,218 | ||
| Calibration 3 | 89,138 | ||
| ssj_ops@calibrated=89,178 | |||
| 100% | 99.0% | 89,178 | 88,277 |
| 90% | 89.9% | 80,260 | 80,168 |
| 80% | 80.8% | 71,342 | 72,017 |
| 70% | 69.1% | 62,424 | 61,637 |
| 60% | 60.3% | 53,507 | 53,787 |
| 50% | 50.2% | 44,589 | 44,763 |
| 40% | 40.3% | 35,671 | 35,948 |
| 30% | 29.3% | 26,753 | 26,091 |
| 20% | 20.1% | 17,836 | 17,882 |
| 10% | 9.9% | 8,918 | 8,825 |
| Active Idle | 0 | 0 | |
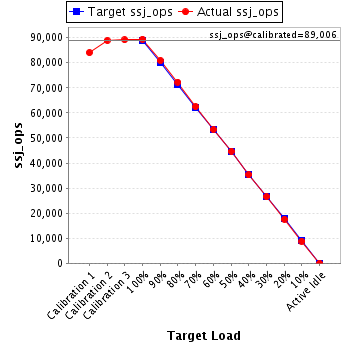
| Target Load | Actual Load | ssj_ops | |
|---|---|---|---|
| Target | Actual | ||
| Calibration 1 | 83,495 | ||
| Calibration 2 | 88,306 | ||
| Calibration 3 | 89,258 | ||
| ssj_ops@calibrated=88,782 | |||
| 100% | 99.4% | 88,782 | 88,232 |
| 90% | 90.4% | 79,904 | 80,227 |
| 80% | 80.5% | 71,026 | 71,469 |
| 70% | 70.1% | 62,148 | 62,207 |
| 60% | 59.4% | 53,269 | 52,775 |
| 50% | 50.0% | 44,391 | 44,425 |
| 40% | 39.9% | 35,513 | 35,424 |
| 30% | 30.4% | 26,635 | 26,950 |
| 20% | 20.4% | 17,756 | 18,140 |
| 10% | 9.6% | 8,878 | 8,562 |
| Active Idle | 0 | 0 | |
| Target Load | Actual Load | ssj_ops | |
|---|---|---|---|
| Target | Actual | ||
| Calibration 1 | 83,078 | ||
| Calibration 2 | 89,511 | ||
| Calibration 3 | 89,068 | ||
| ssj_ops@calibrated=89,289 | |||
| 100% | 100.3% | 89,289 | 89,552 |
| 90% | 90.6% | 80,360 | 80,915 |
| 80% | 80.1% | 71,431 | 71,549 |
| 70% | 70.5% | 62,502 | 62,911 |
| 60% | 60.4% | 53,574 | 53,919 |
| 50% | 49.3% | 44,645 | 44,006 |
| 40% | 40.8% | 35,716 | 36,416 |
| 30% | 29.1% | 26,787 | 26,007 |
| 20% | 19.9% | 17,858 | 17,811 |
| 10% | 9.9% | 8,929 | 8,825 |
| Active Idle | 0 | 0 | |

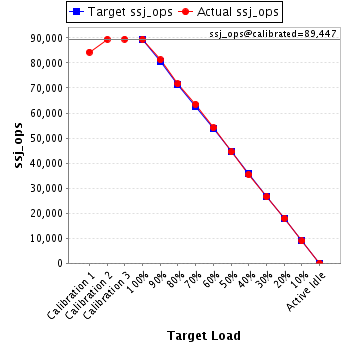
| Target Load | Actual Load | ssj_ops | |
|---|---|---|---|
| Target | Actual | ||
| Calibration 1 | 85,508 | ||
| Calibration 2 | 89,897 | ||
| Calibration 3 | 90,026 | ||
| ssj_ops@calibrated=89,961 | |||
| 100% | 100.2% | 89,961 | 90,136 |
| 90% | 89.9% | 80,965 | 80,878 |
| 80% | 79.7% | 71,969 | 71,665 |
| 70% | 69.8% | 62,973 | 62,794 |
| 60% | 59.5% | 53,977 | 53,511 |
| 50% | 50.1% | 44,981 | 45,031 |
| 40% | 41.4% | 35,985 | 37,226 |
| 30% | 29.9% | 26,988 | 26,939 |
| 20% | 20.2% | 17,992 | 18,136 |
| 10% | 9.8% | 8,996 | 8,829 |
| Active Idle | 0 | 0 | |

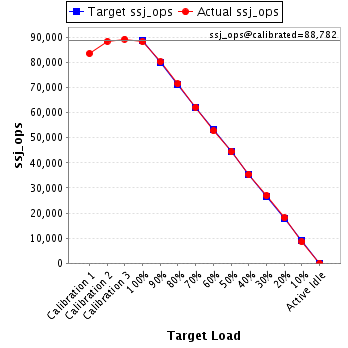
| Target Load | Actual Load | ssj_ops | |
|---|---|---|---|
| Target | Actual | ||
| Calibration 1 | 84,338 | ||
| Calibration 2 | 89,404 | ||
| Calibration 3 | 89,490 | ||
| ssj_ops@calibrated=89,447 | |||
| 100% | 100.0% | 89,447 | 89,448 |
| 90% | 90.9% | 80,503 | 81,277 |
| 80% | 80.1% | 71,558 | 71,629 |
| 70% | 71.0% | 62,613 | 63,516 |
| 60% | 60.4% | 53,668 | 54,059 |
| 50% | 49.7% | 44,724 | 44,497 |
| 40% | 39.6% | 35,779 | 35,402 |
| 30% | 29.7% | 26,834 | 26,548 |
| 20% | 20.1% | 17,889 | 17,978 |
| 10% | 10.0% | 8,945 | 8,907 |
| Active Idle | 0 | 0 | |
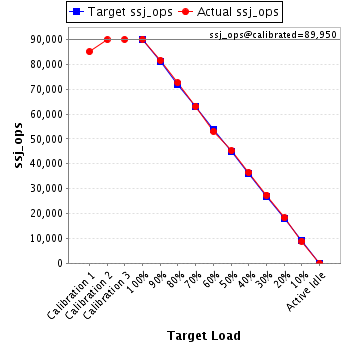
| Target Load | Actual Load | ssj_ops | |
|---|---|---|---|
| Target | Actual | ||
| Calibration 1 | 85,061 | ||
| Calibration 2 | 89,928 | ||
| Calibration 3 | 89,973 | ||
| ssj_ops@calibrated=89,950 | |||
| 100% | 100.2% | 89,950 | 90,118 |
| 90% | 90.7% | 80,955 | 81,594 |
| 80% | 80.7% | 71,960 | 72,567 |
| 70% | 70.2% | 62,965 | 63,156 |
| 60% | 59.0% | 53,970 | 53,041 |
| 50% | 50.4% | 44,975 | 45,304 |
| 40% | 40.6% | 35,980 | 36,517 |
| 30% | 30.5% | 26,985 | 27,445 |
| 20% | 20.3% | 17,990 | 18,295 |
| 10% | 9.8% | 8,995 | 8,837 |
| Active Idle | 0 | 0 | |
| Target Load | Actual Load | ssj_ops | |
|---|---|---|---|
| Target | Actual | ||
| Calibration 1 | 83,050 | ||
| Calibration 2 | 89,261 | ||
| Calibration 3 | 89,021 | ||
| ssj_ops@calibrated=89,141 | |||
| 100% | 100.1% | 89,141 | 89,220 |
| 90% | 90.6% | 80,227 | 80,780 |
| 80% | 80.3% | 71,313 | 71,557 |
| 70% | 70.9% | 62,399 | 63,180 |
| 60% | 60.8% | 53,485 | 54,191 |
| 50% | 49.9% | 44,571 | 44,504 |
| 40% | 40.9% | 35,656 | 36,477 |
| 30% | 29.9% | 26,742 | 26,651 |
| 20% | 19.9% | 17,828 | 17,782 |
| 10% | 9.8% | 8,914 | 8,740 |
| Active Idle | 0 | 0 | |

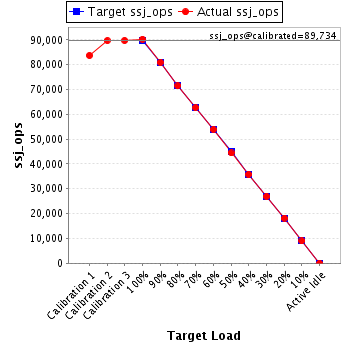
| Target Load | Actual Load | ssj_ops | |
|---|---|---|---|
| Target | Actual | ||
| Calibration 1 | 83,698 | ||
| Calibration 2 | 89,699 | ||
| Calibration 3 | 89,769 | ||
| ssj_ops@calibrated=89,734 | |||
| 100% | 100.6% | 89,734 | 90,281 |
| 90% | 90.2% | 80,761 | 80,972 |
| 80% | 79.6% | 71,787 | 71,430 |
| 70% | 69.8% | 62,814 | 62,639 |
| 60% | 60.1% | 53,840 | 53,957 |
| 50% | 49.5% | 44,867 | 44,433 |
| 40% | 39.9% | 35,894 | 35,800 |
| 30% | 30.1% | 26,920 | 27,011 |
| 20% | 20.3% | 17,947 | 18,228 |
| 10% | 10.0% | 8,973 | 8,970 |
| Active Idle | 0 | 0 | |
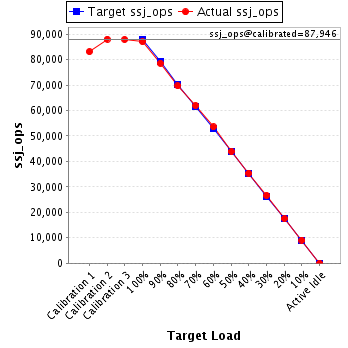
| Target Load | Actual Load | ssj_ops | |
|---|---|---|---|
| Target | Actual | ||
| Calibration 1 | 83,048 | ||
| Calibration 2 | 88,010 | ||
| Calibration 3 | 87,883 | ||
| ssj_ops@calibrated=87,946 | |||
| 100% | 98.9% | 87,946 | 87,012 |
| 90% | 89.3% | 79,152 | 78,555 |
| 80% | 79.2% | 70,357 | 69,652 |
| 70% | 70.5% | 61,562 | 61,971 |
| 60% | 60.9% | 52,768 | 53,562 |
| 50% | 49.9% | 43,973 | 43,895 |
| 40% | 40.3% | 35,179 | 35,399 |
| 30% | 30.3% | 26,384 | 26,657 |
| 20% | 19.9% | 17,589 | 17,541 |
| 10% | 10.3% | 8,795 | 9,066 |
| Active Idle | 0 | 0 | |
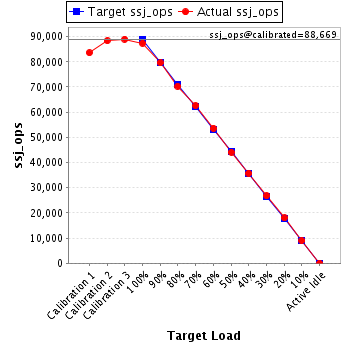
| Target Load | Actual Load | ssj_ops | |
|---|---|---|---|
| Target | Actual | ||
| Calibration 1 | 83,563 | ||
| Calibration 2 | 88,342 | ||
| Calibration 3 | 88,995 | ||
| ssj_ops@calibrated=88,669 | |||
| 100% | 98.6% | 88,669 | 87,419 |
| 90% | 89.8% | 79,802 | 79,609 |
| 80% | 79.3% | 70,935 | 70,290 |
| 70% | 70.5% | 62,068 | 62,545 |
| 60% | 60.5% | 53,201 | 53,610 |
| 50% | 49.7% | 44,334 | 44,094 |
| 40% | 40.3% | 35,467 | 35,732 |
| 30% | 30.2% | 26,601 | 26,758 |
| 20% | 20.3% | 17,734 | 17,978 |
| 10% | 10.1% | 8,867 | 8,979 |
| Active Idle | 0 | 0 | |
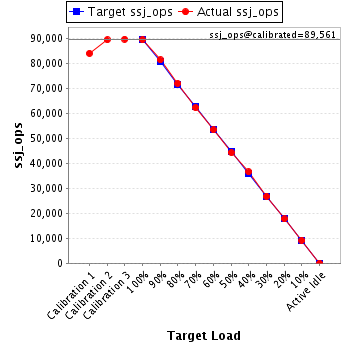
| Target Load | Actual Load | ssj_ops | |
|---|---|---|---|
| Target | Actual | ||
| Calibration 1 | 84,007 | ||
| Calibration 2 | 89,408 | ||
| Calibration 3 | 89,713 | ||
| ssj_ops@calibrated=89,561 | |||
| 100% | 99.8% | 89,561 | 89,420 |
| 90% | 90.9% | 80,605 | 81,416 |
| 80% | 80.4% | 71,649 | 72,022 |
| 70% | 69.5% | 62,693 | 62,282 |
| 60% | 59.7% | 53,736 | 53,423 |
| 50% | 49.5% | 44,780 | 44,295 |
| 40% | 40.8% | 35,824 | 36,553 |
| 30% | 29.9% | 26,868 | 26,810 |
| 20% | 19.8% | 17,912 | 17,728 |
| 10% | 10.2% | 8,956 | 9,169 |
| Active Idle | 0 | 0 | |
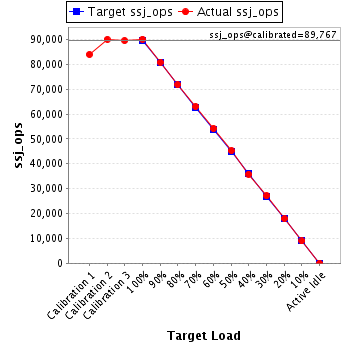
| Target Load | Actual Load | ssj_ops | |
|---|---|---|---|
| Target | Actual | ||
| Calibration 1 | 83,971 | ||
| Calibration 2 | 90,030 | ||
| Calibration 3 | 89,504 | ||
| ssj_ops@calibrated=89,767 | |||
| 100% | 100.4% | 89,767 | 90,114 |
| 90% | 90.1% | 80,790 | 80,870 |
| 80% | 80.0% | 71,814 | 71,779 |
| 70% | 70.2% | 62,837 | 63,040 |
| 60% | 60.4% | 53,860 | 54,185 |
| 50% | 50.5% | 44,883 | 45,297 |
| 40% | 40.0% | 35,907 | 35,869 |
| 30% | 30.2% | 26,930 | 27,108 |
| 20% | 20.0% | 17,953 | 17,943 |
| 10% | 10.0% | 8,977 | 8,974 |
| Active Idle | 0 | 0 | |