
SPECpower_ssj2008
JVM Instance 'WIN-S5D1BAVP3PA.031' Performance Report
Copyright © 2007-2014 Standard Performance Evaluation Corporation
| Quanta Computer Inc. QuantaGrid D51B-2U | ssj_ops@100% = 91,471 | ||||
| Test Sponsor: | Quanta Computer Inc. | SPEC License #: | 9050 | Test Method: | Single Node |
| Tested By: | Quanta Computer Inc. | Test Location: | Taoyuan, TW, R.O.C | Test Date: | Nov 22, 2014 |
| Hardware Availability: | Sep-2014 | Software Availability: | Jun-2013 | Publication: | Dec 10, 2014 |
| System Source: | Single Supplier | System Designation: | Server | Power Provisioning: | Line-powered |
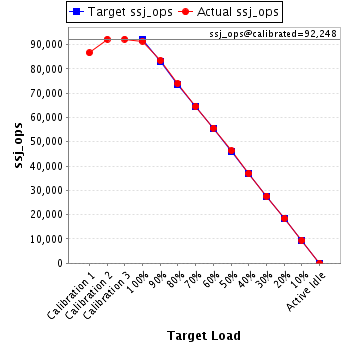
| Target Load | Actual Load | ssj_ops | |
|---|---|---|---|
| Target | Actual | ||
| Calibration 1 | 86,590 | ||
| Calibration 2 | 92,241 | ||
| Calibration 3 | 92,255 | ||
| ssj_ops@calibrated=92,248 | |||
| 100% | 99.2% | 92,248 | 91,471 |
| 90% | 90.5% | 83,023 | 83,492 |
| 80% | 80.2% | 73,798 | 73,980 |
| 70% | 70.1% | 64,574 | 64,648 |
| 60% | 60.3% | 55,349 | 55,668 |
| 50% | 50.3% | 46,124 | 46,357 |
| 40% | 40.1% | 36,899 | 36,982 |
| 30% | 30.0% | 27,674 | 27,669 |
| 20% | 20.1% | 18,450 | 18,530 |
| 10% | 10.2% | 9,225 | 9,404 |
| Active Idle | 0 | 0 | |
| Set Identifier: | S2B |
| Set Description: | System Under Test |
| # of Identical Nodes: | 1 |
| Comment: | None |
| Hardware | |
|---|---|
| Hardware Vendor: | Quanta Computer Inc. |
| Model: | QuantaGrid D51B-2U |
| Form Factor: | 2U |
| CPU Name: | Intel Xeon E5-2699 v3 2.30 GHz |
| CPU Characteristics: | 18 core, 2.3GHz, 45MB L3 Cache |
| CPU Frequency (MHz): | 2300 |
| CPU(s) Enabled: | 36 cores, 2 chips, 18 cores/chip |
| Hardware Threads: | 72 (2 / core) |
| CPU(s) Orderable: | 1,2 chips |
| Primary Cache: | 32 KB I + 32 KB D on chip per core |
| Secondary Cache: | 256 KB I+D on chip per chip |
| Tertiary Cache: | 45 MB I+D off chip per chip |
| Other Cache: | None |
| Memory Amount (GB): | 64 |
| # and size of DIMM: | 8 x 8192 MB |
| Memory Details: | 8GB 2Rx8 PC4-2133P-RE0-10; slots A0, B0, C0, D0, E0, F0, G0 ,H0 populated |
| Power Supply Quantity and Rating (W): | 1 x 500 |
| Power Supply Details: | Quanta P/N AF500B00028 |
| Disk Drive: | 1 x 960G SATA SSD,Quanta P/N ABSAK960000 |
| Disk Controller: | Integrated SATA controller |
| # and type of Network Interface Cards (NICs) Installed: | 1 x Intel Ethernet Controller I350, 2-port |
| NICs Enabled in Firmware / OS / Connected: | 2/2/1 |
| Network Speed (Mbit): | 1000 |
| Keyboard: | None |
| Mouse: | None |
| Monitor: | None |
| Optical Drives: | No |
| Other Hardware: | None |
| Software | |
|---|---|
| Power Management: | Balanced power plan in OS |
| Operating System (OS): | Microsoft Windows Server 2008 R2 Enterprise with SP1 |
| OS Version: | Version 6.1.7601 Service Pack 1 Build 7601 |
| Filesystem: | NTFS |
| JVM Vendor: | IBM Corporation |
| JVM Version: | IBM J9 VM (build 2.6, JRE 1.7.0 Windows Server 2008 R2 amd64-64 20120322_106209 (JIT enabled, AOT enabled) |
| JVM Command-line Options: | -Xmn825m -Xms975m -Xmx975m -Xaggressive -Xcompressedrefs -Xgcpolicy:gencon -XlockReservation -Xnoloa -XtlhPrefetch -Xlp -Xconcurrentlevel0 -Xthr:minimizeusercpu -Xgcthreads2 (-Xgcthreads1 for JVM5 and JVM23) |
| JVM Affinity: | start /NODE [0,1,2,3] /AFFINITY [0x3,0xC,0x30,0xC0,0x300,0xC00,0x3000,0xC000,0x30000] |
| JVM Instances: | 36 |
| JVM Initial Heap (MB): | 975 |
| JVM Maximum Heap (MB): | 975 |
| JVM Address Bits: | 64 |
| Boot Firmware Version: | 3A08 |
| Management Firmware Version: | 3.07 |
| Workload Version: | SSJ 1.2.10 |
| Director Location: | Controller |
| Other Software: | IBM WebSphere Application Server V8.5.0.0, Microsoft Hotfix for Windows (KB2510206) |
| Target Load | Actual Load | Transaction Type | Count | Total Heap (MB) |
|---|---|---|---|---|
| Calibration 1 | New Order | 6,297,811 | 975 | |
| Payment | 6,297,814 | |||
| Order Status | 629,780 | |||
| Delivery | 629,782 | |||
| Stock Level | 629,782 | |||
| Customer Report | 6,297,813 | |||
| Calibration 2 | New Order | 6,708,795 | 975 | |
| Payment | 6,708,797 | |||
| Order Status | 670,879 | |||
| Delivery | 670,880 | |||
| Stock Level | 670,880 | |||
| Customer Report | 6,708,797 | |||
| Calibration 3 | New Order | 6,709,860 | 975 | |
| Payment | 6,709,863 | |||
| Order Status | 670,985 | |||
| Delivery | 670,987 | |||
| Stock Level | 670,985 | |||
| Customer Report | 6,709,857 | |||
| 100% | 99.2% | New Order | 6,652,865 | 975 |
| Payment | 6,652,866 | |||
| Order Status | 665,288 | |||
| Delivery | 665,286 | |||
| Stock Level | 665,288 | |||
| Customer Report | 6,652,862 | |||
| 90% | 90.5% | New Order | 6,072,509 | 975 |
| Payment | 6,072,512 | |||
| Order Status | 607,252 | |||
| Delivery | 607,252 | |||
| Stock Level | 607,252 | |||
| Customer Report | 6,072,506 | |||
| 80% | 80.2% | New Order | 5,380,691 | 975 |
| Payment | 5,380,686 | |||
| Order Status | 538,069 | |||
| Delivery | 538,069 | |||
| Stock Level | 538,069 | |||
| Customer Report | 5,380,689 | |||
| 70% | 70.1% | New Order | 4,701,893 | 975 |
| Payment | 4,701,897 | |||
| Order Status | 470,189 | |||
| Delivery | 470,191 | |||
| Stock Level | 470,188 | |||
| Customer Report | 4,701,894 | |||
| 60% | 60.3% | New Order | 4,048,831 | 975 |
| Payment | 4,048,825 | |||
| Order Status | 404,883 | |||
| Delivery | 404,883 | |||
| Stock Level | 404,883 | |||
| Customer Report | 4,048,826 | |||
| 50% | 50.3% | New Order | 3,371,594 | 975 |
| Payment | 3,371,595 | |||
| Order Status | 337,159 | |||
| Delivery | 337,160 | |||
| Stock Level | 337,159 | |||
| Customer Report | 3,371,595 | |||
| 40% | 40.1% | New Order | 2,689,769 | 975 |
| Payment | 2,689,769 | |||
| Order Status | 268,977 | |||
| Delivery | 268,979 | |||
| Stock Level | 268,977 | |||
| Customer Report | 2,689,765 | |||
| 30% | 30.0% | New Order | 2,012,424 | 975 |
| Payment | 2,012,424 | |||
| Order Status | 201,241 | |||
| Delivery | 201,242 | |||
| Stock Level | 201,242 | |||
| Customer Report | 2,012,427 | |||
| 20% | 20.1% | New Order | 1,347,707 | 975 |
| Payment | 1,347,702 | |||
| Order Status | 134,770 | |||
| Delivery | 134,771 | |||
| Stock Level | 134,770 | |||
| Customer Report | 1,347,706 | |||
| 10% | 10.2% | New Order | 683,939 | 975 |
| Payment | 683,940 | |||
| Order Status | 68,393 | |||
| Delivery | 68,394 | |||
| Stock Level | 68,394 | |||
| Customer Report | 683,940 | |||
| Active Idle | New Order | 0 | 975 | |
| Payment | 0 | |||
| Order Status | 0 | |||
| Delivery | 0 | |||
| Stock Level | 0 | |||
| Customer Report | 0 | |||