SPECpower_ssj2008
Host 'Bobby-Blade8' Performance Report
Copyright © 2007-2016 Standard Performance Evaluation Corporation
| Dell Inc. PowerEdge M630 (Intel Xeon E5-2699 v4, 2.20 GHz) | ssj_ops@100% = 3,574,388 ssj_ops@100% per JVM = 893,597 |
||||
| Test Sponsor: | Dell Inc. | SPEC License #: | 55 | Test Method: | Multi Node |
| Tested By: | Dell Inc. | Test Location: | Round Rock, TX, USA | Test Date: | May 5, 2016 |
| Hardware Availability: | Mar-2016 | Software Availability: | Apr-2015 | Publication: | May 25, 2016 |
| System Source: | Single Supplier | System Designation: | Server | Power Provisioning: | Line-powered |
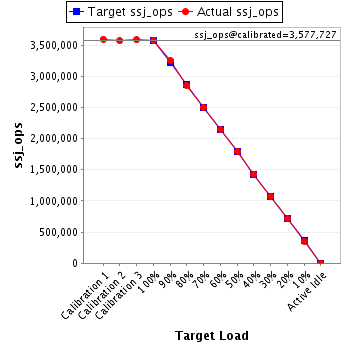
| Target Load | Actual Load | ssj_ops | |
|---|---|---|---|
| Target | Actual | ||
| Calibration 1 | 3,596,524 | ||
| Calibration 2 | 3,569,460 | ||
| Calibration 3 | 3,585,995 | ||
| ssj_ops@calibrated=3,577,727 | |||
| 100% | 99.9% | 3,577,727 | 3,574,388 |
| 90% | 91.0% | 3,219,955 | 3,254,510 |
| 80% | 79.9% | 2,862,182 | 2,858,532 |
| 70% | 69.9% | 2,504,409 | 2,501,015 |
| 60% | 60.0% | 2,146,636 | 2,144,936 |
| 50% | 50.2% | 1,788,864 | 1,794,440 |
| 40% | 40.0% | 1,431,091 | 1,431,738 |
| 30% | 30.0% | 1,073,318 | 1,074,293 |
| 20% | 20.0% | 715,545 | 716,465 |
| 10% | 9.9% | 357,773 | 354,927 |
| Active Idle | 0 | 0 | |
| Set Identifier: | sut |
| Set Description: | System Under Test |
| # of Identical Nodes: | 16 |
| Comment: | M630 |
| Hardware | |
|---|---|
| Hardware Vendor: | Dell Inc. |
| Model: | PowerEdge M630 (Intel Xeon E5-2699 v4, 2.20 GHz) |
| Form Factor: | Blade |
| CPU Name: | Intel Xeon E5-2699 v4 2.20 GHz |
| CPU Characteristics: | 22 Core, 2.20 GHz, 55 MB L3 Cache |
| CPU Frequency (MHz): | 2200 |
| CPU(s) Enabled: | 44 cores, 2 chips, 22 cores/chip |
| Hardware Threads: | 88 (2 / core) |
| CPU(s) Orderable: | 1,2 chips |
| Primary Cache: | 32 KB I + 32 KB D on chip per core |
| Secondary Cache: | 256 KB I+D on chip per core |
| Tertiary Cache: | 55 MB I+D on chip per chip |
| Other Cache: | None |
| Memory Amount (GB): | 128 |
| # and size of DIMM: | 8 x 16 GB |
| Memory Details: | 16GB 2Rx4 PC4-2400T ECC, Dell P/N HNDJ7, Slots A1-4, B1-4 populated |
| Power Supply Quantity and Rating (W): | None |
| Power Supply Details: | Shared |
| Disk Drive: | 1 x 120 GB 2.5" SATA SSD, Dell P/N:KX83R |
| Disk Controller: | Embedded SATA |
| # and type of Network Interface Cards (NICs) Installed: | 1 x Onboard Broadcom BCM57810 10Gb Dual Port, Dell P/N C0P7J |
| NICs Enabled in Firmware / OS / Connected: | 2/2/1 |
| Network Speed (Mbit): | 1000 |
| Keyboard: | None |
| Mouse: | None |
| Monitor: | None |
| Optical Drives: | No |
| Other Hardware: | None |
| Software | |
|---|---|
| Power Management: | Power Saver Mode in OS |
| Operating System (OS): | Microsoft Windows Server 2012 R2 Datacenter |
| OS Version: | Version 6.3.9600.17196 |
| Filesystem: | NTFS |
| JVM Vendor: | Oracle |
| JVM Version: | Java HotSpot 64-Bit Server VM (build 24.80-b11, mixed mode), version 1.7.0_80 |
| JVM Command-line Options: | -server -Xmx13g -Xms13g -Xmn11g -XX:SurvivorRatio=1 -XX:TargetSurvivorRatio=99 -XX:ParallelGCThreads=22 -XX:AllocatePrefetchDistance=256 -XX:AllocatePrefetchLines=4 -XX:LoopUnrollLimit=45 -XX:InitialTenuringThreshold=12 -XX:MaxTenuringThreshold=15 -XX:InlineSmallCode=9000 -XX:MaxInlineSize=270 -XX:FreqInlineSize=6000 -XX:+UseLargePages -XX:+UseParallelOldGC -XX:+AggressiveOpts" |
| JVM Affinity: | start /NODE [0,1,2,3] /affinity [3FFFFF] |
| JVM Instances: | 4 |
| JVM Initial Heap (MB): | 13000 |
| JVM Maximum Heap (MB): | 13000 |
| JVM Address Bits: | 64 |
| Boot Firmware Version: | 2.0.1 |
| Management Firmware Version: | 2.30.30.30 |
| Workload Version: | SSJ 1.2.10 |
| Director Location: | Controller |
| Other Software: | None |
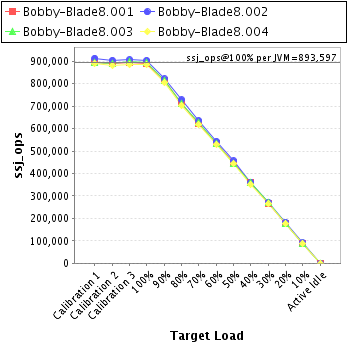
| JVM Instance | ssj_ops@100% |
|---|---|
| Bobby-Blade8.001 | 892,394 |
| Bobby-Blade8.002 | 904,159 |
| Bobby-Blade8.003 | 893,362 |
| Bobby-Blade8.004 | 884,473 |
| ssj_ops@100% | 3,574,388 |
| ssj_ops@100% per JVM | 893,597 |
| Target Load | Actual Load | ssj_ops | |
|---|---|---|---|
| Target | Actual | ||
| Calibration 1 | 894,018 | ||
| Calibration 2 | 890,303 | ||
| Calibration 3 | 896,581 | ||
| ssj_ops@calibrated=893,442 | |||
| 100% | 99.9% | 893,442 | 892,394 |
| 90% | 91.0% | 804,098 | 812,683 |
| 80% | 79.7% | 714,754 | 712,234 |
| 70% | 69.5% | 625,410 | 621,385 |
| 60% | 59.9% | 536,065 | 535,198 |
| 50% | 50.2% | 446,721 | 448,665 |
| 40% | 40.1% | 357,377 | 358,346 |
| 30% | 30.0% | 268,033 | 267,814 |
| 20% | 19.9% | 178,688 | 177,511 |
| 10% | 9.9% | 89,344 | 88,519 |
| Active Idle | 0 | 0 | |
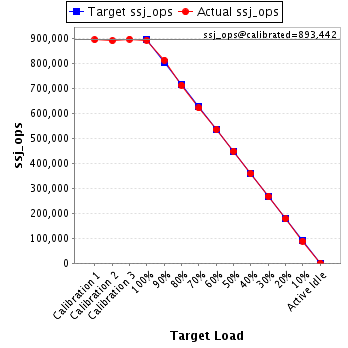
| Target Load | Actual Load | ssj_ops | |
|---|---|---|---|
| Target | Actual | ||
| Calibration 1 | 914,188 | ||
| Calibration 2 | 905,180 | ||
| Calibration 3 | 906,824 | ||
| ssj_ops@calibrated=906,002 | |||
| 100% | 99.8% | 906,002 | 904,159 |
| 90% | 90.7% | 815,402 | 821,682 |
| 80% | 80.4% | 724,802 | 728,085 |
| 70% | 70.1% | 634,201 | 635,098 |
| 60% | 60.0% | 543,601 | 543,557 |
| 50% | 50.4% | 453,001 | 456,404 |
| 40% | 40.0% | 362,401 | 362,098 |
| 30% | 30.0% | 271,801 | 272,202 |
| 20% | 20.2% | 181,200 | 183,350 |
| 10% | 10.0% | 90,600 | 90,516 |
| Active Idle | 0 | 0 | |

| Target Load | Actual Load | ssj_ops | |
|---|---|---|---|
| Target | Actual | ||
| Calibration 1 | 896,267 | ||
| Calibration 2 | 891,078 | ||
| Calibration 3 | 898,342 | ||
| ssj_ops@calibrated=894,710 | |||
| 100% | 99.8% | 894,710 | 893,362 |
| 90% | 91.1% | 805,239 | 814,967 |
| 80% | 79.7% | 715,768 | 713,276 |
| 70% | 70.0% | 626,297 | 626,397 |
| 60% | 59.8% | 536,826 | 534,939 |
| 50% | 49.8% | 447,355 | 445,941 |
| 40% | 40.1% | 357,884 | 358,357 |
| 30% | 30.2% | 268,413 | 270,094 |
| 20% | 19.9% | 178,942 | 178,316 |
| 10% | 9.9% | 89,471 | 88,999 |
| Active Idle | 0 | 0 | |

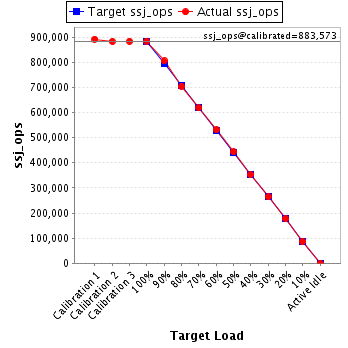
| Target Load | Actual Load | ssj_ops | |
|---|---|---|---|
| Target | Actual | ||
| Calibration 1 | 892,052 | ||
| Calibration 2 | 882,898 | ||
| Calibration 3 | 884,248 | ||
| ssj_ops@calibrated=883,573 | |||
| 100% | 100.1% | 883,573 | 884,473 |
| 90% | 91.1% | 795,215 | 805,177 |
| 80% | 79.8% | 706,858 | 704,937 |
| 70% | 70.0% | 618,501 | 618,135 |
| 60% | 60.1% | 530,144 | 531,242 |
| 50% | 50.2% | 441,786 | 443,431 |
| 40% | 39.9% | 353,429 | 352,938 |
| 30% | 29.9% | 265,072 | 264,182 |
| 20% | 20.1% | 176,715 | 177,287 |
| 10% | 9.8% | 88,357 | 86,893 |
| Active Idle | 0 | 0 | |