SPECpower_ssj2008
Host 'NODE02' Performance Report
Copyright © 2007-2018 Standard Performance Evaluation Corporation
| Hewlett Packard Enterprise Synergy 480 Gen10 Compute Module | ssj_ops@100% = 5,727,435 ssj_ops@100% per JVM = 1,431,859 |
||||
| Test Sponsor: | Hewlett Packard Enterprise | SPEC License #: | 3 | Test Method: | Multi Node |
| Tested By: | Hewlett Packard Enterprise | Test Location: | Houston, TX, USA | Test Date: | Aug 26, 2018 |
| Hardware Availability: | Jun-2018 | Software Availability: | Mar-2018 | Publication: | Sep 12, 2018 |
| System Source: | Single Supplier | System Designation: | Server | Power Provisioning: | Line-powered |
| Target Load | Actual Load | ssj_ops | |
|---|---|---|---|
| Target | Actual | ||
| Calibration 1 | 5,751,106 | ||
| Calibration 2 | 5,735,499 | ||
| Calibration 3 | 5,750,682 | ||
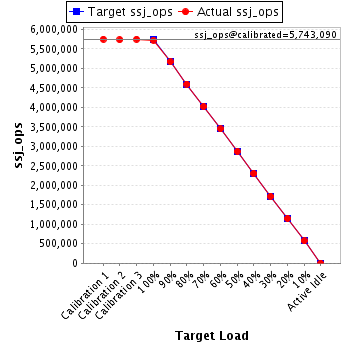
| ssj_ops@calibrated=5,743,090 | |||
| 100% | 99.7% | 5,743,090 | 5,727,435 |
| 90% | 90.0% | 5,168,781 | 5,171,265 |
| 80% | 80.1% | 4,594,472 | 4,599,617 |
| 70% | 70.1% | 4,020,163 | 4,026,971 |
| 60% | 60.0% | 3,445,854 | 3,447,122 |
| 50% | 50.0% | 2,871,545 | 2,871,049 |
| 40% | 40.1% | 2,297,236 | 2,302,251 |
| 30% | 29.9% | 1,722,927 | 1,719,395 |
| 20% | 20.0% | 1,148,618 | 1,148,565 |
| 10% | 10.0% | 574,309 | 575,751 |
| Active Idle | 0 | 0 | |
| Set Identifier: | SUT |
| Set Description: | System Under Test |
| # of Identical Nodes: | 7 |
| Comment: | SUT |
| Hardware | |
|---|---|
| Hardware Vendor: | Hewlett Packard Enterprise |
| Model: | Synergy 480 Gen10 Compute Module |
| Form Factor: | Other |
| CPU Name: | Intel Xeon Platinum 8180 2.50GHz |
| CPU Characteristics: | 28-Core, 2.50 GHz, 38.5 MB L3 Cache |
| CPU Frequency (MHz): | 2500 |
| CPU(s) Enabled: | 56 cores, 2 chips, 28 cores/chip |
| Hardware Threads: | 112 (2 / core) |
| CPU(s) Orderable: | 1,2 chips |
| Primary Cache: | 32 KB I + 32 KB D on chip per core |
| Secondary Cache: | 1 MB I+D on chip per core |
| Tertiary Cache: | 39424 KB I+D on chip per chip |
| Other Cache: | None |
| Memory Amount (GB): | 192 |
| # and size of DIMM: | 12 x 16384 MB |
| Memory Details: | 12 x 16GB 2Rx8 PC4-2666-V ECC; slots 1, 3, 5, 8, 10 and 12 populated on each CPU socket |
| Power Supply Quantity and Rating (W): | None |
| Power Supply Details: | Shared |
| Disk Drive: | 1 x HPE Synergy 480 Gen10 M.2 FIO Adapter Board Kit (873165-B21); 1 x HPE 480GB SATA 6G Read Intensive M.2 2280 SSD (875498-B21) |
| Disk Controller: | 1 x HPE Smart Array S100i SR Gen10 |
| # and type of Network Interface Cards (NICs) Installed: | 1 x HPE Synergy 3820C 10/20Gb 2-port Converged Network Adapter (777430-B21) |
| NICs Enabled in Firmware / OS / Connected: | 2/1/1 |
| Network Speed (Mbit): | 10000 |
| Keyboard: | None |
| Mouse: | None |
| Monitor: | None |
| Optical Drives: | No |
| Other Hardware: | None |
| Software | |
|---|---|
| Power Management: | Enabled (see SUT Notes) |
| Operating System (OS): | Windows Server 2012 R2 Datacenter |
| OS Version: | 6.3 (Build 9600) |
| Filesystem: | NTFS |
| JVM Vendor: | Oracle Corporation |
| JVM Version: | Java HotSpot(TM) 64-Bit Server VM (build 24.80-b11, mixed mode), version 1.7.0_80 |
| JVM Command-line Options: | -server -Xmn19g -Xms21g -Xmx21g -XX:SurvivorRatio=1 -XX:TargetSurvivorRatio=99 -XX:ParallelGCThreads=28 -XX:AllocatePrefetchDistance=256 -XX:AllocatePrefetchLines=4 -XX:LoopUnrollLimit=45 -XX:InitialTenuringThreshold=12 -XX:MaxTenuringThreshold=15 -XX:InlineSmallCode=9000 -XX:MaxInlineSize=270 -XX:FreqInlineSize=6000 -XX:+UseLargePages -XX:+UseParallelOldGC -XX:+AggressiveOpts |
| JVM Affinity: | start /NODE [0,1,2,3] /AFFINITY [0xFFFFFFF] |
| JVM Instances: | 4 |
| JVM Initial Heap (MB): | 21000 |
| JVM Maximum Heap (MB): | 21000 |
| JVM Address Bits: | 64 |
| Boot Firmware Version: | I42 v1.32 (02/01/2018) |
| Management Firmware Version: | 1.15 Aug 17 2017 |
| Workload Version: | SSJ 1.2.10 |
| Director Location: | Controller |
| Other Software: | HPE Composer Version 3.10.07 (HPE OneView) with HPE Synergy Custom SPP Bundle 2017.10.20180323; Microsoft Windows KB4054519, KB4056898 |
| JVM Instance | ssj_ops@100% |
|---|---|
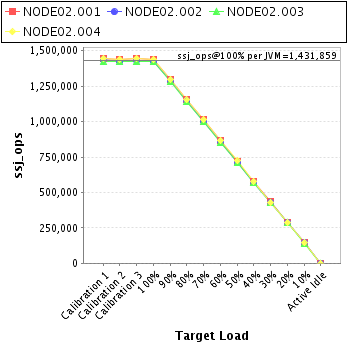
| NODE02.001 | 1,438,230 |
| NODE02.002 | 1,424,341 |
| NODE02.003 | 1,424,301 |
| NODE02.004 | 1,440,564 |
| ssj_ops@100% | 5,727,435 |
| ssj_ops@100% per JVM | 1,431,859 |
| Target Load | Actual Load | ssj_ops | |
|---|---|---|---|
| Target | Actual | ||
| Calibration 1 | 1,445,146 | ||
| Calibration 2 | 1,441,319 | ||
| Calibration 3 | 1,443,925 | ||
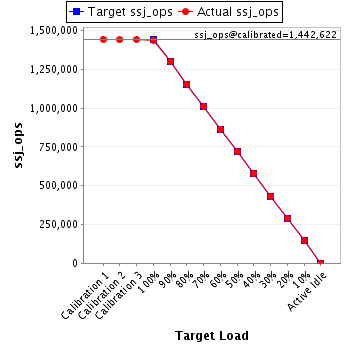
| ssj_ops@calibrated=1,442,622 | |||
| 100% | 99.7% | 1,442,622 | 1,438,230 |
| 90% | 90.1% | 1,298,360 | 1,299,598 |
| 80% | 80.0% | 1,154,098 | 1,154,216 |
| 70% | 70.1% | 1,009,835 | 1,011,605 |
| 60% | 59.9% | 865,573 | 863,655 |
| 50% | 50.0% | 721,311 | 721,645 |
| 40% | 40.2% | 577,049 | 579,252 |
| 30% | 30.0% | 432,787 | 432,557 |
| 20% | 20.2% | 288,524 | 290,905 |
| 10% | 10.1% | 144,262 | 145,529 |
| Active Idle | 0 | 0 | |
| Target Load | Actual Load | ssj_ops | |
|---|---|---|---|
| Target | Actual | ||
| Calibration 1 | 1,435,396 | ||
| Calibration 2 | 1,426,197 | ||
| Calibration 3 | 1,431,914 | ||
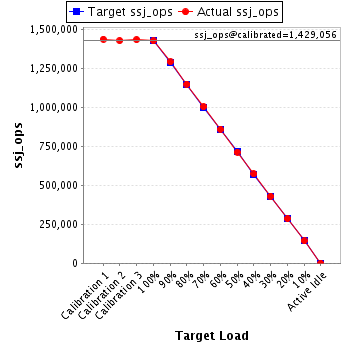
| ssj_ops@calibrated=1,429,056 | |||
| 100% | 99.7% | 1,429,056 | 1,424,341 |
| 90% | 90.3% | 1,286,150 | 1,289,953 |
| 80% | 80.3% | 1,143,244 | 1,147,689 |
| 70% | 70.2% | 1,000,339 | 1,002,517 |
| 60% | 60.1% | 857,433 | 859,540 |
| 50% | 49.9% | 714,528 | 712,667 |
| 40% | 40.0% | 571,622 | 572,049 |
| 30% | 30.1% | 428,717 | 430,409 |
| 20% | 19.9% | 285,811 | 284,842 |
| 10% | 10.0% | 142,906 | 143,485 |
| Active Idle | 0 | 0 | |
| Target Load | Actual Load | ssj_ops | |
|---|---|---|---|
| Target | Actual | ||
| Calibration 1 | 1,425,026 | ||
| Calibration 2 | 1,426,360 | ||
| Calibration 3 | 1,427,023 | ||
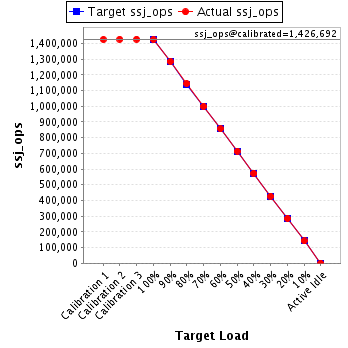
| ssj_ops@calibrated=1,426,692 | |||
| 100% | 99.8% | 1,426,692 | 1,424,301 |
| 90% | 90.0% | 1,284,023 | 1,284,480 |
| 80% | 80.2% | 1,141,353 | 1,144,751 |
| 70% | 70.1% | 998,684 | 999,751 |
| 60% | 60.0% | 856,015 | 856,030 |
| 50% | 50.1% | 713,346 | 714,222 |
| 40% | 40.1% | 570,677 | 572,017 |
| 30% | 30.0% | 428,008 | 427,442 |
| 20% | 20.0% | 285,338 | 285,036 |
| 10% | 10.0% | 142,669 | 141,981 |
| Active Idle | 0 | 0 | |
| Target Load | Actual Load | ssj_ops | |
|---|---|---|---|
| Target | Actual | ||
| Calibration 1 | 1,445,538 | ||
| Calibration 2 | 1,441,623 | ||
| Calibration 3 | 1,447,819 | ||
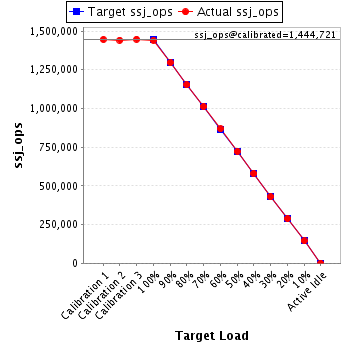
| ssj_ops@calibrated=1,444,721 | |||
| 100% | 99.7% | 1,444,721 | 1,440,564 |
| 90% | 89.8% | 1,300,249 | 1,297,234 |
| 80% | 79.8% | 1,155,777 | 1,152,960 |
| 70% | 70.1% | 1,011,305 | 1,013,097 |
| 60% | 60.1% | 866,833 | 867,898 |
| 50% | 50.0% | 722,361 | 722,515 |
| 40% | 40.1% | 577,888 | 578,934 |
| 30% | 29.7% | 433,416 | 428,987 |
| 20% | 19.9% | 288,944 | 287,781 |
| 10% | 10.0% | 144,472 | 144,755 |
| Active Idle | 0 | 0 | |