SPECpower_ssj2008
Host 'NODE03' Performance Report
Copyright © 2007-2018 Standard Performance Evaluation Corporation
| Hewlett Packard Enterprise Synergy 480 Gen10 Compute Module | ssj_ops@100% = 5,762,662 ssj_ops@100% per JVM = 1,440,666 |
||||
| Test Sponsor: | Hewlett Packard Enterprise | SPEC License #: | 3 | Test Method: | Multi Node |
| Tested By: | Hewlett Packard Enterprise | Test Location: | Houston, TX, USA | Test Date: | Aug 26, 2018 |
| Hardware Availability: | Jun-2018 | Software Availability: | Mar-2018 | Publication: | Sep 12, 2018 |
| System Source: | Single Supplier | System Designation: | Server | Power Provisioning: | Line-powered |
| Target Load | Actual Load | ssj_ops | |
|---|---|---|---|
| Target | Actual | ||
| Calibration 1 | 5,777,969 | ||
| Calibration 2 | 5,773,560 | ||
| Calibration 3 | 5,783,160 | ||
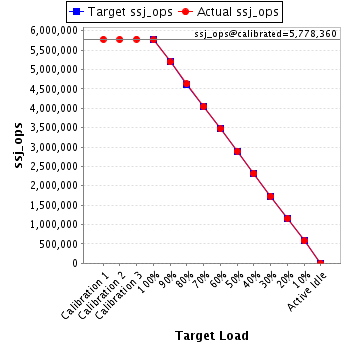
| ssj_ops@calibrated=5,778,360 | |||
| 100% | 99.7% | 5,778,360 | 5,762,662 |
| 90% | 89.9% | 5,200,524 | 5,194,300 |
| 80% | 80.1% | 4,622,688 | 4,629,304 |
| 70% | 70.0% | 4,044,852 | 4,044,149 |
| 60% | 60.0% | 3,467,016 | 3,465,924 |
| 50% | 50.1% | 2,889,180 | 2,893,625 |
| 40% | 40.0% | 2,311,344 | 2,313,266 |
| 30% | 30.0% | 1,733,508 | 1,733,065 |
| 20% | 19.9% | 1,155,672 | 1,152,586 |
| 10% | 10.0% | 577,836 | 578,828 |
| Active Idle | 0 | 0 | |
| Set Identifier: | SUT |
| Set Description: | System Under Test |
| # of Identical Nodes: | 7 |
| Comment: | SUT |
| Hardware | |
|---|---|
| Hardware Vendor: | Hewlett Packard Enterprise |
| Model: | Synergy 480 Gen10 Compute Module |
| Form Factor: | Other |
| CPU Name: | Intel Xeon Platinum 8180 2.50GHz |
| CPU Characteristics: | 28-Core, 2.50 GHz, 38.5 MB L3 Cache |
| CPU Frequency (MHz): | 2500 |
| CPU(s) Enabled: | 56 cores, 2 chips, 28 cores/chip |
| Hardware Threads: | 112 (2 / core) |
| CPU(s) Orderable: | 1,2 chips |
| Primary Cache: | 32 KB I + 32 KB D on chip per core |
| Secondary Cache: | 1 MB I+D on chip per core |
| Tertiary Cache: | 39424 KB I+D on chip per chip |
| Other Cache: | None |
| Memory Amount (GB): | 192 |
| # and size of DIMM: | 12 x 16384 MB |
| Memory Details: | 12 x 16GB 2Rx8 PC4-2666-V ECC; slots 1, 3, 5, 8, 10 and 12 populated on each CPU socket |
| Power Supply Quantity and Rating (W): | None |
| Power Supply Details: | Shared |
| Disk Drive: | 1 x HPE Synergy 480 Gen10 M.2 FIO Adapter Board Kit (873165-B21); 1 x HPE 480GB SATA 6G Read Intensive M.2 2280 SSD (875498-B21) |
| Disk Controller: | 1 x HPE Smart Array S100i SR Gen10 |
| # and type of Network Interface Cards (NICs) Installed: | 1 x HPE Synergy 3820C 10/20Gb 2-port Converged Network Adapter (777430-B21) |
| NICs Enabled in Firmware / OS / Connected: | 2/1/1 |
| Network Speed (Mbit): | 10000 |
| Keyboard: | None |
| Mouse: | None |
| Monitor: | None |
| Optical Drives: | No |
| Other Hardware: | None |
| Software | |
|---|---|
| Power Management: | Enabled (see SUT Notes) |
| Operating System (OS): | Windows Server 2012 R2 Datacenter |
| OS Version: | 6.3 (Build 9600) |
| Filesystem: | NTFS |
| JVM Vendor: | Oracle Corporation |
| JVM Version: | Java HotSpot(TM) 64-Bit Server VM (build 24.80-b11, mixed mode), version 1.7.0_80 |
| JVM Command-line Options: | -server -Xmn19g -Xms21g -Xmx21g -XX:SurvivorRatio=1 -XX:TargetSurvivorRatio=99 -XX:ParallelGCThreads=28 -XX:AllocatePrefetchDistance=256 -XX:AllocatePrefetchLines=4 -XX:LoopUnrollLimit=45 -XX:InitialTenuringThreshold=12 -XX:MaxTenuringThreshold=15 -XX:InlineSmallCode=9000 -XX:MaxInlineSize=270 -XX:FreqInlineSize=6000 -XX:+UseLargePages -XX:+UseParallelOldGC -XX:+AggressiveOpts |
| JVM Affinity: | start /NODE [0,1,2,3] /AFFINITY [0xFFFFFFF] |
| JVM Instances: | 4 |
| JVM Initial Heap (MB): | 21000 |
| JVM Maximum Heap (MB): | 21000 |
| JVM Address Bits: | 64 |
| Boot Firmware Version: | I42 v1.32 (02/01/2018) |
| Management Firmware Version: | 1.15 Aug 17 2017 |
| Workload Version: | SSJ 1.2.10 |
| Director Location: | Controller |
| Other Software: | HPE Composer Version 3.10.07 (HPE OneView) with HPE Synergy Custom SPP Bundle 2017.10.20180323; Microsoft Windows KB4054519, KB4056898 |
| JVM Instance | ssj_ops@100% |
|---|---|
| NODE03.001 | 1,443,021 |
| NODE03.002 | 1,428,807 |
| NODE03.003 | 1,448,027 |
| NODE03.004 | 1,442,807 |
| ssj_ops@100% | 5,762,662 |
| ssj_ops@100% per JVM | 1,440,666 |

| Target Load | Actual Load | ssj_ops | |
|---|---|---|---|
| Target | Actual | ||
| Calibration 1 | 1,449,808 | ||
| Calibration 2 | 1,444,338 | ||
| Calibration 3 | 1,450,425 | ||
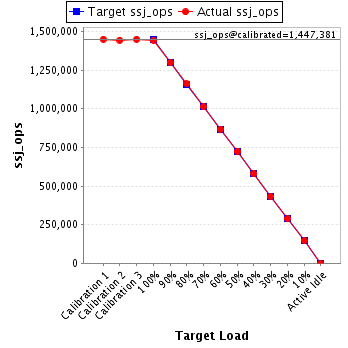
| ssj_ops@calibrated=1,447,381 | |||
| 100% | 99.7% | 1,447,381 | 1,443,021 |
| 90% | 89.6% | 1,302,643 | 1,297,413 |
| 80% | 80.2% | 1,157,905 | 1,160,698 |
| 70% | 70.0% | 1,013,167 | 1,012,670 |
| 60% | 60.0% | 868,429 | 868,783 |
| 50% | 50.0% | 723,691 | 723,012 |
| 40% | 40.0% | 578,952 | 579,133 |
| 30% | 29.9% | 434,214 | 432,838 |
| 20% | 20.0% | 289,476 | 288,955 |
| 10% | 10.1% | 144,738 | 145,726 |
| Active Idle | 0 | 0 | |
| Target Load | Actual Load | ssj_ops | |
|---|---|---|---|
| Target | Actual | ||
| Calibration 1 | 1,435,739 | ||
| Calibration 2 | 1,432,669 | ||
| Calibration 3 | 1,433,867 | ||
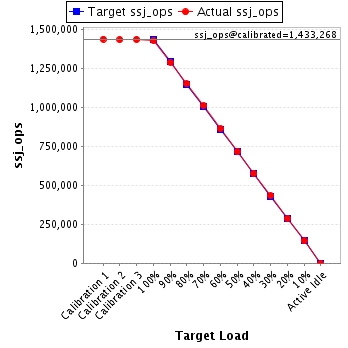
| ssj_ops@calibrated=1,433,268 | |||
| 100% | 99.7% | 1,433,268 | 1,428,807 |
| 90% | 89.9% | 1,289,941 | 1,288,863 |
| 80% | 80.2% | 1,146,615 | 1,149,420 |
| 70% | 70.3% | 1,003,288 | 1,008,244 |
| 60% | 60.1% | 859,961 | 860,947 |
| 50% | 49.9% | 716,634 | 715,617 |
| 40% | 40.1% | 573,307 | 575,187 |
| 30% | 30.1% | 429,980 | 431,538 |
| 20% | 19.9% | 286,654 | 285,696 |
| 10% | 10.0% | 143,327 | 143,520 |
| Active Idle | 0 | 0 | |
| Target Load | Actual Load | ssj_ops | |
|---|---|---|---|
| Target | Actual | ||
| Calibration 1 | 1,451,635 | ||
| Calibration 2 | 1,453,115 | ||
| Calibration 3 | 1,453,367 | ||
| ssj_ops@calibrated=1,453,241 | |||
| 100% | 99.6% | 1,453,241 | 1,448,027 |
| 90% | 89.9% | 1,307,917 | 1,306,080 |
| 80% | 80.2% | 1,162,593 | 1,165,355 |
| 70% | 69.9% | 1,017,269 | 1,015,901 |
| 60% | 59.9% | 871,945 | 870,854 |
| 50% | 50.2% | 726,621 | 729,904 |
| 40% | 40.1% | 581,296 | 583,026 |
| 30% | 29.9% | 435,972 | 434,348 |
| 20% | 19.9% | 290,648 | 289,825 |
| 10% | 10.0% | 145,324 | 145,576 |
| Active Idle | 0 | 0 | |

| Target Load | Actual Load | ssj_ops | |
|---|---|---|---|
| Target | Actual | ||
| Calibration 1 | 1,440,787 | ||
| Calibration 2 | 1,443,439 | ||
| Calibration 3 | 1,445,500 | ||
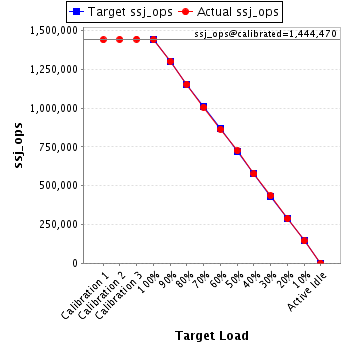
| ssj_ops@calibrated=1,444,470 | |||
| 100% | 99.9% | 1,444,470 | 1,442,807 |
| 90% | 90.1% | 1,300,023 | 1,301,943 |
| 80% | 79.9% | 1,155,576 | 1,153,831 |
| 70% | 69.7% | 1,011,129 | 1,007,334 |
| 60% | 59.9% | 866,682 | 865,341 |
| 50% | 50.2% | 722,235 | 725,091 |
| 40% | 39.9% | 577,788 | 575,920 |
| 30% | 30.1% | 433,341 | 434,340 |
| 20% | 19.9% | 288,894 | 288,109 |
| 10% | 10.0% | 144,447 | 144,006 |
| Active Idle | 0 | 0 | |