SPECpower_ssj2008
Host 'NODE07' Performance Report
Copyright © 2007-2018 Standard Performance Evaluation Corporation
| Hewlett Packard Enterprise Synergy 480 Gen10 Compute Module | ssj_ops@100% = 5,713,355 ssj_ops@100% per JVM = 1,428,339 |
||||
| Test Sponsor: | Hewlett Packard Enterprise | SPEC License #: | 3 | Test Method: | Multi Node |
| Tested By: | Hewlett Packard Enterprise | Test Location: | Houston, TX, USA | Test Date: | Aug 26, 2018 |
| Hardware Availability: | Jun-2018 | Software Availability: | Mar-2018 | Publication: | Sep 12, 2018 |
| System Source: | Single Supplier | System Designation: | Server | Power Provisioning: | Line-powered |
| Target Load | Actual Load | ssj_ops | |
|---|---|---|---|
| Target | Actual | ||
| Calibration 1 | 5,732,928 | ||
| Calibration 2 | 5,723,325 | ||
| Calibration 3 | 5,734,491 | ||
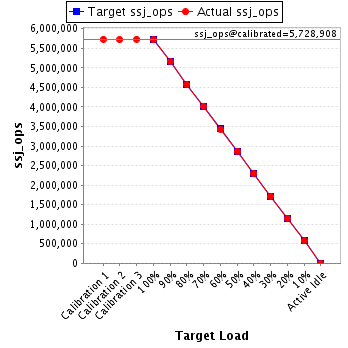
| ssj_ops@calibrated=5,728,908 | |||
| 100% | 99.7% | 5,728,908 | 5,713,355 |
| 90% | 90.0% | 5,156,017 | 5,157,261 |
| 80% | 80.0% | 4,583,126 | 4,580,729 |
| 70% | 70.0% | 4,010,235 | 4,010,765 |
| 60% | 59.9% | 3,437,345 | 3,432,988 |
| 50% | 50.1% | 2,864,454 | 2,868,514 |
| 40% | 40.0% | 2,291,563 | 2,289,831 |
| 30% | 30.0% | 1,718,672 | 1,716,937 |
| 20% | 20.0% | 1,145,782 | 1,147,375 |
| 10% | 10.0% | 572,891 | 570,924 |
| Active Idle | 0 | 0 | |
| Set Identifier: | SUT |
| Set Description: | System Under Test |
| # of Identical Nodes: | 7 |
| Comment: | SUT |
| Hardware | |
|---|---|
| Hardware Vendor: | Hewlett Packard Enterprise |
| Model: | Synergy 480 Gen10 Compute Module |
| Form Factor: | Other |
| CPU Name: | Intel Xeon Platinum 8180 2.50GHz |
| CPU Characteristics: | 28-Core, 2.50 GHz, 38.5 MB L3 Cache |
| CPU Frequency (MHz): | 2500 |
| CPU(s) Enabled: | 56 cores, 2 chips, 28 cores/chip |
| Hardware Threads: | 112 (2 / core) |
| CPU(s) Orderable: | 1,2 chips |
| Primary Cache: | 32 KB I + 32 KB D on chip per core |
| Secondary Cache: | 1 MB I+D on chip per core |
| Tertiary Cache: | 39424 KB I+D on chip per chip |
| Other Cache: | None |
| Memory Amount (GB): | 192 |
| # and size of DIMM: | 12 x 16384 MB |
| Memory Details: | 12 x 16GB 2Rx8 PC4-2666-V ECC; slots 1, 3, 5, 8, 10 and 12 populated on each CPU socket |
| Power Supply Quantity and Rating (W): | None |
| Power Supply Details: | Shared |
| Disk Drive: | 1 x HPE Synergy 480 Gen10 M.2 FIO Adapter Board Kit (873165-B21); 1 x HPE 480GB SATA 6G Read Intensive M.2 2280 SSD (875498-B21) |
| Disk Controller: | 1 x HPE Smart Array S100i SR Gen10 |
| # and type of Network Interface Cards (NICs) Installed: | 1 x HPE Synergy 3820C 10/20Gb 2-port Converged Network Adapter (777430-B21) |
| NICs Enabled in Firmware / OS / Connected: | 2/1/1 |
| Network Speed (Mbit): | 10000 |
| Keyboard: | None |
| Mouse: | None |
| Monitor: | None |
| Optical Drives: | No |
| Other Hardware: | None |
| Software | |
|---|---|
| Power Management: | Enabled (see SUT Notes) |
| Operating System (OS): | Windows Server 2012 R2 Datacenter |
| OS Version: | 6.3 (Build 9600) |
| Filesystem: | NTFS |
| JVM Vendor: | Oracle Corporation |
| JVM Version: | Java HotSpot(TM) 64-Bit Server VM (build 24.80-b11, mixed mode), version 1.7.0_80 |
| JVM Command-line Options: | -server -Xmn19g -Xms21g -Xmx21g -XX:SurvivorRatio=1 -XX:TargetSurvivorRatio=99 -XX:ParallelGCThreads=28 -XX:AllocatePrefetchDistance=256 -XX:AllocatePrefetchLines=4 -XX:LoopUnrollLimit=45 -XX:InitialTenuringThreshold=12 -XX:MaxTenuringThreshold=15 -XX:InlineSmallCode=9000 -XX:MaxInlineSize=270 -XX:FreqInlineSize=6000 -XX:+UseLargePages -XX:+UseParallelOldGC -XX:+AggressiveOpts |
| JVM Affinity: | start /NODE [0,1,2,3] /AFFINITY [0xFFFFFFF] |
| JVM Instances: | 4 |
| JVM Initial Heap (MB): | 21000 |
| JVM Maximum Heap (MB): | 21000 |
| JVM Address Bits: | 64 |
| Boot Firmware Version: | I42 v1.32 (02/01/2018) |
| Management Firmware Version: | 1.15 Aug 17 2017 |
| Workload Version: | SSJ 1.2.10 |
| Director Location: | Controller |
| Other Software: | HPE Composer Version 3.10.07 (HPE OneView) with HPE Synergy Custom SPP Bundle 2017.10.20180323; Microsoft Windows KB4054519, KB4056898 |
| JVM Instance | ssj_ops@100% |
|---|---|
| NODE07.001 | 1,416,498 |
| NODE07.002 | 1,447,549 |
| NODE07.003 | 1,423,662 |
| NODE07.004 | 1,425,646 |
| ssj_ops@100% | 5,713,355 |
| ssj_ops@100% per JVM | 1,428,339 |

| Target Load | Actual Load | ssj_ops | |
|---|---|---|---|
| Target | Actual | ||
| Calibration 1 | 1,421,666 | ||
| Calibration 2 | 1,419,698 | ||
| Calibration 3 | 1,422,238 | ||
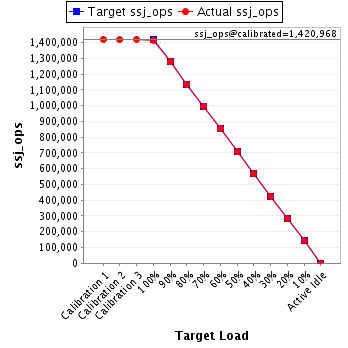
| ssj_ops@calibrated=1,420,968 | |||
| 100% | 99.7% | 1,420,968 | 1,416,498 |
| 90% | 89.9% | 1,278,871 | 1,277,405 |
| 80% | 79.9% | 1,136,774 | 1,135,571 |
| 70% | 70.0% | 994,678 | 994,734 |
| 60% | 60.2% | 852,581 | 855,048 |
| 50% | 50.0% | 710,484 | 709,990 |
| 40% | 40.0% | 568,387 | 567,815 |
| 30% | 30.0% | 426,290 | 426,588 |
| 20% | 20.1% | 284,194 | 285,065 |
| 10% | 10.0% | 142,097 | 141,962 |
| Active Idle | 0 | 0 | |
| Target Load | Actual Load | ssj_ops | |
|---|---|---|---|
| Target | Actual | ||
| Calibration 1 | 1,450,544 | ||
| Calibration 2 | 1,446,893 | ||
| Calibration 3 | 1,452,730 | ||
| ssj_ops@calibrated=1,449,812 | |||
| 100% | 99.8% | 1,449,812 | 1,447,549 |
| 90% | 90.1% | 1,304,830 | 1,306,746 |
| 80% | 80.0% | 1,159,849 | 1,160,210 |
| 70% | 70.2% | 1,014,868 | 1,018,319 |
| 60% | 59.8% | 869,887 | 866,704 |
| 50% | 49.9% | 724,906 | 723,928 |
| 40% | 40.0% | 579,925 | 579,267 |
| 30% | 29.9% | 434,943 | 433,453 |
| 20% | 20.0% | 289,962 | 290,437 |
| 10% | 9.9% | 144,981 | 143,475 |
| Active Idle | 0 | 0 | |

| Target Load | Actual Load | ssj_ops | |
|---|---|---|---|
| Target | Actual | ||
| Calibration 1 | 1,430,250 | ||
| Calibration 2 | 1,428,139 | ||
| Calibration 3 | 1,428,536 | ||
| ssj_ops@calibrated=1,428,337 | |||
| 100% | 99.7% | 1,428,337 | 1,423,662 |
| 90% | 90.0% | 1,285,504 | 1,285,322 |
| 80% | 79.9% | 1,142,670 | 1,141,395 |
| 70% | 70.0% | 999,836 | 999,467 |
| 60% | 59.8% | 857,002 | 853,860 |
| 50% | 50.0% | 714,169 | 714,706 |
| 40% | 40.0% | 571,335 | 571,782 |
| 30% | 30.0% | 428,501 | 428,901 |
| 20% | 20.1% | 285,667 | 287,361 |
| 10% | 10.1% | 142,834 | 143,600 |
| Active Idle | 0 | 0 | |

| Target Load | Actual Load | ssj_ops | |
|---|---|---|---|
| Target | Actual | ||
| Calibration 1 | 1,430,467 | ||
| Calibration 2 | 1,428,595 | ||
| Calibration 3 | 1,430,986 | ||
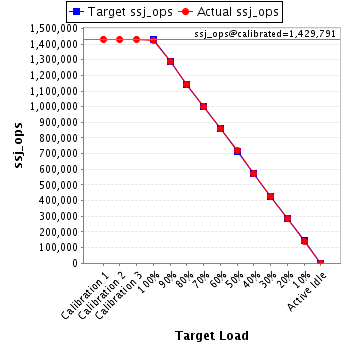
| ssj_ops@calibrated=1,429,791 | |||
| 100% | 99.7% | 1,429,791 | 1,425,646 |
| 90% | 90.1% | 1,286,812 | 1,287,788 |
| 80% | 80.0% | 1,143,833 | 1,143,553 |
| 70% | 69.8% | 1,000,854 | 998,244 |
| 60% | 60.0% | 857,874 | 857,375 |
| 50% | 50.3% | 714,895 | 719,890 |
| 40% | 39.9% | 571,916 | 570,968 |
| 30% | 29.9% | 428,937 | 427,995 |
| 20% | 19.9% | 285,958 | 284,511 |
| 10% | 9.9% | 142,979 | 141,887 |
| Active Idle | 0 | 0 | |