SPECpower_ssj2008
Host 'NODE02' Performance Report
Copyright © 2007-2018 Standard Performance Evaluation Corporation
| Hewlett Packard Enterprise Synergy 480 Gen10 Compute Module | ssj_ops@100% = 5,718,092 ssj_ops@100% per JVM = 1,429,523 |
||||
| Test Sponsor: | Hewlett Packard Enterprise | SPEC License #: | 3 | Test Method: | Multi Node |
| Tested By: | Hewlett Packard Enterprise | Test Location: | Houston, TX, USA | Test Date: | Aug 29, 2018 |
| Hardware Availability: | Jun-2018 | Software Availability: | Mar-2018 | Publication: | Sep 12, 2018 |
| System Source: | Single Supplier | System Designation: | Server | Power Provisioning: | Line-powered |
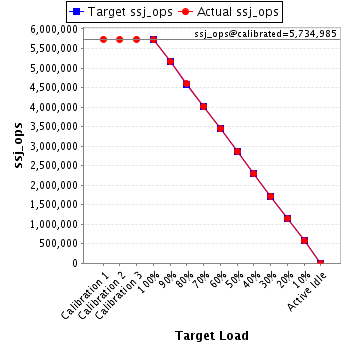
| Target Load | Actual Load | ssj_ops | |
|---|---|---|---|
| Target | Actual | ||
| Calibration 1 | 5,735,840 | ||
| Calibration 2 | 5,730,693 | ||
| Calibration 3 | 5,739,278 | ||
| ssj_ops@calibrated=5,734,985 | |||
| 100% | 99.7% | 5,734,985 | 5,718,092 |
| 90% | 90.0% | 5,161,487 | 5,161,005 |
| 80% | 80.1% | 4,587,988 | 4,591,810 |
| 70% | 70.0% | 4,014,490 | 4,015,339 |
| 60% | 60.0% | 3,440,991 | 3,443,159 |
| 50% | 50.0% | 2,867,493 | 2,865,104 |
| 40% | 39.9% | 2,293,994 | 2,289,620 |
| 30% | 30.0% | 1,720,496 | 1,720,823 |
| 20% | 20.0% | 1,146,997 | 1,146,396 |
| 10% | 10.0% | 573,499 | 574,259 |
| Active Idle | 0 | 0 | |
| Set Identifier: | SUT |
| Set Description: | System Under Test |
| # of Identical Nodes: | 5 |
| Comment: | SUT |
| Hardware | |
|---|---|
| Hardware Vendor: | Hewlett Packard Enterprise |
| Model: | Synergy 480 Gen10 Compute Module |
| Form Factor: | Other |
| CPU Name: | Intel Xeon Platinum 8180 2.50GHz |
| CPU Characteristics: | 28-Core, 2.50 GHz, 38.5 MB L3 Cache |
| CPU Frequency (MHz): | 2500 |
| CPU(s) Enabled: | 56 cores, 2 chips, 28 cores/chip |
| Hardware Threads: | 112 (2 / core) |
| CPU(s) Orderable: | 1,2 chips |
| Primary Cache: | 32 KB I + 32 KB D on chip per core |
| Secondary Cache: | 1 MB I+D on chip per core |
| Tertiary Cache: | 39424 KB I+D on chip per chip |
| Other Cache: | None |
| Memory Amount (GB): | 192 |
| # and size of DIMM: | 12 x 16384 MB |
| Memory Details: | 12 x 16GB 2Rx8 PC4-2666-V ECC; slots 1, 3, 5, 8, 10 and 12 populated on each CPU socket |
| Power Supply Quantity and Rating (W): | None |
| Power Supply Details: | Shared |
| Disk Drive: | 1 x HPE Synergy 480 Gen10 M.2 FIO Adapter Board Kit (873165-B21); 1 x HPE 480GB SATA 6G Read Intensive M.2 2280 SSD (875498-B21) |
| Disk Controller: | 1 x HPE Smart Array S100i SR Gen10 |
| # and type of Network Interface Cards (NICs) Installed: | 1 x HPE Synergy 3820C 10/20Gb 2-port Converged Network Adapter (777430-B21) |
| NICs Enabled in Firmware / OS / Connected: | 2/1/1 |
| Network Speed (Mbit): | 10000 |
| Keyboard: | None |
| Mouse: | None |
| Monitor: | None |
| Optical Drives: | No |
| Other Hardware: | None |
| Software | |
|---|---|
| Power Management: | Enabled (see SUT Notes) |
| Operating System (OS): | Windows Server 2012 R2 Datacenter |
| OS Version: | 6.3 (Build 9600) |
| Filesystem: | NTFS |
| JVM Vendor: | Oracle Corporation |
| JVM Version: | Java HotSpot(TM) 64-Bit Server VM (build 24.80-b11, mixed mode), version 1.7.0_80 |
| JVM Command-line Options: | -server -Xmn19g -Xms21g -Xmx21g -XX:SurvivorRatio=1 -XX:TargetSurvivorRatio=99 -XX:ParallelGCThreads=28 -XX:AllocatePrefetchDistance=256 -XX:AllocatePrefetchLines=4 -XX:LoopUnrollLimit=45 -XX:InitialTenuringThreshold=12 -XX:MaxTenuringThreshold=15 -XX:InlineSmallCode=9000 -XX:MaxInlineSize=270 -XX:FreqInlineSize=6000 -XX:+UseLargePages -XX:+UseParallelOldGC -XX:+AggressiveOpts |
| JVM Affinity: | start /NODE [0,1,2,3] /AFFINITY [0xFFFFFFF] |
| JVM Instances: | 4 |
| JVM Initial Heap (MB): | 21000 |
| JVM Maximum Heap (MB): | 21000 |
| JVM Address Bits: | 64 |
| Boot Firmware Version: | I42 v1.32 (02/01/2018) |
| Management Firmware Version: | 1.15 Aug 17 2017 |
| Workload Version: | SSJ 1.2.10 |
| Director Location: | Controller |
| Other Software: | HPE Composer Version 3.10.07 (HPE OneView) with HPE Synergy Custom SPP Bundle 2017.10.20180323; Microsoft Windows KB4054519, KB4056898 |
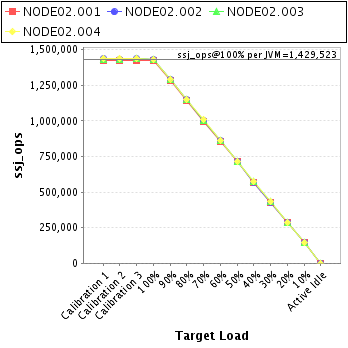
| JVM Instance | ssj_ops@100% |
|---|---|
| NODE02.001 | 1,421,636 |
| NODE02.002 | 1,432,564 |
| NODE02.003 | 1,430,714 |
| NODE02.004 | 1,433,178 |
| ssj_ops@100% | 5,718,092 |
| ssj_ops@100% per JVM | 1,429,523 |
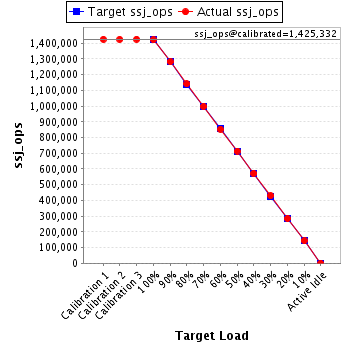
| Target Load | Actual Load | ssj_ops | |
|---|---|---|---|
| Target | Actual | ||
| Calibration 1 | 1,426,026 | ||
| Calibration 2 | 1,424,476 | ||
| Calibration 3 | 1,426,188 | ||
| ssj_ops@calibrated=1,425,332 | |||
| 100% | 99.7% | 1,425,332 | 1,421,636 |
| 90% | 90.0% | 1,282,799 | 1,282,116 |
| 80% | 80.1% | 1,140,266 | 1,141,489 |
| 70% | 70.1% | 997,732 | 998,953 |
| 60% | 59.9% | 855,199 | 853,871 |
| 50% | 50.1% | 712,666 | 714,074 |
| 40% | 40.1% | 570,133 | 570,923 |
| 30% | 30.1% | 427,600 | 429,517 |
| 20% | 20.0% | 285,066 | 284,394 |
| 10% | 10.1% | 142,533 | 143,363 |
| Active Idle | 0 | 0 | |
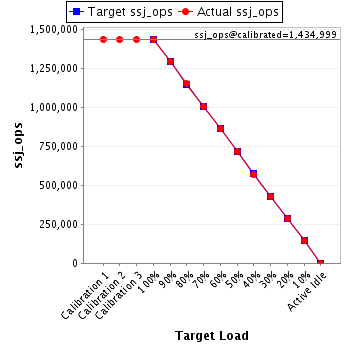
| Target Load | Actual Load | ssj_ops | |
|---|---|---|---|
| Target | Actual | ||
| Calibration 1 | 1,436,900 | ||
| Calibration 2 | 1,434,549 | ||
| Calibration 3 | 1,435,448 | ||
| ssj_ops@calibrated=1,434,999 | |||
| 100% | 99.8% | 1,434,999 | 1,432,564 |
| 90% | 90.2% | 1,291,499 | 1,293,696 |
| 80% | 80.2% | 1,147,999 | 1,150,674 |
| 70% | 70.1% | 1,004,499 | 1,005,220 |
| 60% | 60.0% | 860,999 | 861,484 |
| 50% | 50.0% | 717,499 | 717,181 |
| 40% | 39.8% | 573,999 | 570,899 |
| 30% | 29.9% | 430,500 | 429,430 |
| 20% | 20.0% | 287,000 | 287,030 |
| 10% | 10.0% | 143,500 | 143,499 |
| Active Idle | 0 | 0 | |
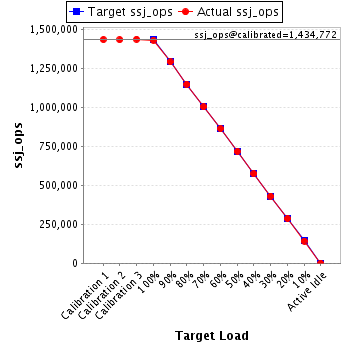
| Target Load | Actual Load | ssj_ops | |
|---|---|---|---|
| Target | Actual | ||
| Calibration 1 | 1,433,570 | ||
| Calibration 2 | 1,432,849 | ||
| Calibration 3 | 1,436,695 | ||
| ssj_ops@calibrated=1,434,772 | |||
| 100% | 99.7% | 1,434,772 | 1,430,714 |
| 90% | 90.0% | 1,291,295 | 1,290,970 |
| 80% | 80.0% | 1,147,818 | 1,147,724 |
| 70% | 69.9% | 1,004,340 | 1,002,309 |
| 60% | 60.1% | 860,863 | 862,369 |
| 50% | 50.0% | 717,386 | 717,397 |
| 40% | 40.0% | 573,909 | 573,208 |
| 30% | 30.0% | 430,432 | 430,971 |
| 20% | 19.9% | 286,954 | 285,906 |
| 10% | 9.9% | 143,477 | 142,538 |
| Active Idle | 0 | 0 | |
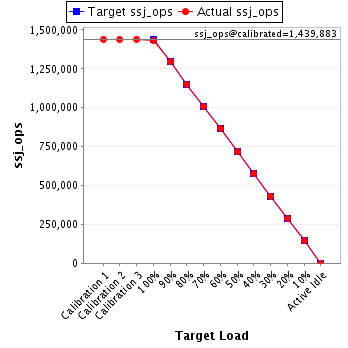
| Target Load | Actual Load | ssj_ops | |
|---|---|---|---|
| Target | Actual | ||
| Calibration 1 | 1,439,344 | ||
| Calibration 2 | 1,438,819 | ||
| Calibration 3 | 1,440,947 | ||
| ssj_ops@calibrated=1,439,883 | |||
| 100% | 99.5% | 1,439,883 | 1,433,178 |
| 90% | 89.9% | 1,295,895 | 1,294,225 |
| 80% | 80.0% | 1,151,906 | 1,151,923 |
| 70% | 70.1% | 1,007,918 | 1,008,856 |
| 60% | 60.1% | 863,930 | 865,435 |
| 50% | 49.8% | 719,941 | 716,452 |
| 40% | 39.9% | 575,953 | 574,590 |
| 30% | 29.9% | 431,965 | 430,904 |
| 20% | 20.1% | 287,977 | 289,065 |
| 10% | 10.1% | 143,988 | 144,859 |
| Active Idle | 0 | 0 | |