SPECpower_ssj2008
Host 'NODE03' Performance Report
Copyright © 2007-2018 Standard Performance Evaluation Corporation
| Hewlett Packard Enterprise Synergy 480 Gen10 Compute Module | ssj_ops@100% = 5,708,355 ssj_ops@100% per JVM = 1,427,089 |
||||
| Test Sponsor: | Hewlett Packard Enterprise | SPEC License #: | 3 | Test Method: | Multi Node |
| Tested By: | Hewlett Packard Enterprise | Test Location: | Houston, TX, USA | Test Date: | Aug 29, 2018 |
| Hardware Availability: | Jun-2018 | Software Availability: | Mar-2018 | Publication: | Sep 12, 2018 |
| System Source: | Single Supplier | System Designation: | Server | Power Provisioning: | Line-powered |
| Target Load | Actual Load | ssj_ops | |
|---|---|---|---|
| Target | Actual | ||
| Calibration 1 | 5,731,556 | ||
| Calibration 2 | 5,718,155 | ||
| Calibration 3 | 5,734,740 | ||
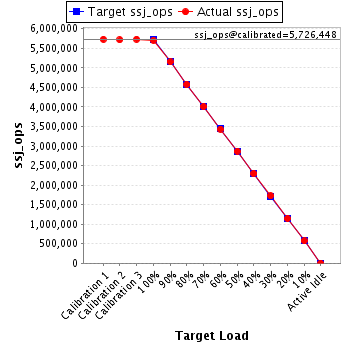
| ssj_ops@calibrated=5,726,448 | |||
| 100% | 99.7% | 5,726,448 | 5,708,355 |
| 90% | 90.0% | 5,153,803 | 5,153,387 |
| 80% | 79.9% | 4,581,158 | 4,576,368 |
| 70% | 70.0% | 4,008,513 | 4,010,864 |
| 60% | 60.0% | 3,435,869 | 3,435,544 |
| 50% | 50.1% | 2,863,224 | 2,868,267 |
| 40% | 40.0% | 2,290,579 | 2,292,345 |
| 30% | 30.1% | 1,717,934 | 1,721,570 |
| 20% | 20.0% | 1,145,290 | 1,144,335 |
| 10% | 10.0% | 572,645 | 571,685 |
| Active Idle | 0 | 0 | |
| Set Identifier: | SUT |
| Set Description: | System Under Test |
| # of Identical Nodes: | 5 |
| Comment: | SUT |
| Hardware | |
|---|---|
| Hardware Vendor: | Hewlett Packard Enterprise |
| Model: | Synergy 480 Gen10 Compute Module |
| Form Factor: | Other |
| CPU Name: | Intel Xeon Platinum 8180 2.50GHz |
| CPU Characteristics: | 28-Core, 2.50 GHz, 38.5 MB L3 Cache |
| CPU Frequency (MHz): | 2500 |
| CPU(s) Enabled: | 56 cores, 2 chips, 28 cores/chip |
| Hardware Threads: | 112 (2 / core) |
| CPU(s) Orderable: | 1,2 chips |
| Primary Cache: | 32 KB I + 32 KB D on chip per core |
| Secondary Cache: | 1 MB I+D on chip per core |
| Tertiary Cache: | 39424 KB I+D on chip per chip |
| Other Cache: | None |
| Memory Amount (GB): | 192 |
| # and size of DIMM: | 12 x 16384 MB |
| Memory Details: | 12 x 16GB 2Rx8 PC4-2666-V ECC; slots 1, 3, 5, 8, 10 and 12 populated on each CPU socket |
| Power Supply Quantity and Rating (W): | None |
| Power Supply Details: | Shared |
| Disk Drive: | 1 x HPE Synergy 480 Gen10 M.2 FIO Adapter Board Kit (873165-B21); 1 x HPE 480GB SATA 6G Read Intensive M.2 2280 SSD (875498-B21) |
| Disk Controller: | 1 x HPE Smart Array S100i SR Gen10 |
| # and type of Network Interface Cards (NICs) Installed: | 1 x HPE Synergy 3820C 10/20Gb 2-port Converged Network Adapter (777430-B21) |
| NICs Enabled in Firmware / OS / Connected: | 2/1/1 |
| Network Speed (Mbit): | 10000 |
| Keyboard: | None |
| Mouse: | None |
| Monitor: | None |
| Optical Drives: | No |
| Other Hardware: | None |
| Software | |
|---|---|
| Power Management: | Enabled (see SUT Notes) |
| Operating System (OS): | Windows Server 2012 R2 Datacenter |
| OS Version: | 6.3 (Build 9600) |
| Filesystem: | NTFS |
| JVM Vendor: | Oracle Corporation |
| JVM Version: | Java HotSpot(TM) 64-Bit Server VM (build 24.80-b11, mixed mode), version 1.7.0_80 |
| JVM Command-line Options: | -server -Xmn19g -Xms21g -Xmx21g -XX:SurvivorRatio=1 -XX:TargetSurvivorRatio=99 -XX:ParallelGCThreads=28 -XX:AllocatePrefetchDistance=256 -XX:AllocatePrefetchLines=4 -XX:LoopUnrollLimit=45 -XX:InitialTenuringThreshold=12 -XX:MaxTenuringThreshold=15 -XX:InlineSmallCode=9000 -XX:MaxInlineSize=270 -XX:FreqInlineSize=6000 -XX:+UseLargePages -XX:+UseParallelOldGC -XX:+AggressiveOpts |
| JVM Affinity: | start /NODE [0,1,2,3] /AFFINITY [0xFFFFFFF] |
| JVM Instances: | 4 |
| JVM Initial Heap (MB): | 21000 |
| JVM Maximum Heap (MB): | 21000 |
| JVM Address Bits: | 64 |
| Boot Firmware Version: | I42 v1.32 (02/01/2018) |
| Management Firmware Version: | 1.15 Aug 17 2017 |
| Workload Version: | SSJ 1.2.10 |
| Director Location: | Controller |
| Other Software: | HPE Composer Version 3.10.07 (HPE OneView) with HPE Synergy Custom SPP Bundle 2017.10.20180323; Microsoft Windows KB4054519, KB4056898 |
| JVM Instance | ssj_ops@100% |
|---|---|
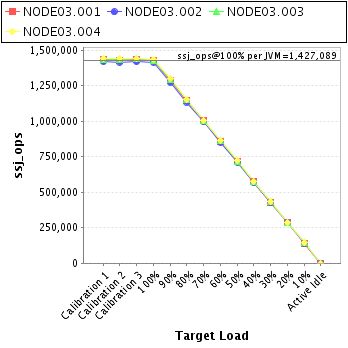
| NODE03.001 | 1,426,206 |
| NODE03.002 | 1,416,025 |
| NODE03.003 | 1,429,258 |
| NODE03.004 | 1,436,865 |
| ssj_ops@100% | 5,708,355 |
| ssj_ops@100% per JVM | 1,427,089 |
| Target Load | Actual Load | ssj_ops | |
|---|---|---|---|
| Target | Actual | ||
| Calibration 1 | 1,434,070 | ||
| Calibration 2 | 1,430,234 | ||
| Calibration 3 | 1,433,926 | ||
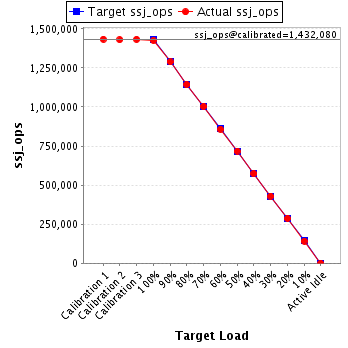
| ssj_ops@calibrated=1,432,080 | |||
| 100% | 99.6% | 1,432,080 | 1,426,206 |
| 90% | 90.0% | 1,288,872 | 1,288,501 |
| 80% | 79.9% | 1,145,664 | 1,144,185 |
| 70% | 70.1% | 1,002,456 | 1,004,520 |
| 60% | 60.0% | 859,248 | 858,546 |
| 50% | 50.1% | 716,040 | 718,026 |
| 40% | 40.0% | 572,832 | 572,836 |
| 30% | 30.0% | 429,624 | 430,296 |
| 20% | 20.0% | 286,416 | 287,008 |
| 10% | 9.9% | 143,208 | 141,547 |
| Active Idle | 0 | 0 | |
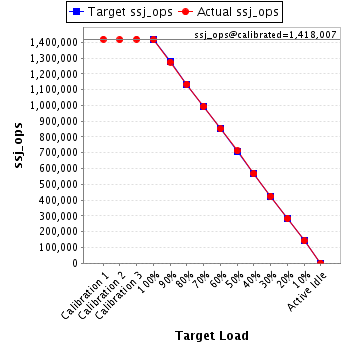
| Target Load | Actual Load | ssj_ops | |
|---|---|---|---|
| Target | Actual | ||
| Calibration 1 | 1,418,991 | ||
| Calibration 2 | 1,416,156 | ||
| Calibration 3 | 1,419,859 | ||
| ssj_ops@calibrated=1,418,007 | |||
| 100% | 99.9% | 1,418,007 | 1,416,025 |
| 90% | 89.9% | 1,276,207 | 1,274,917 |
| 80% | 80.0% | 1,134,406 | 1,134,356 |
| 70% | 70.1% | 992,605 | 994,352 |
| 60% | 60.0% | 850,804 | 851,356 |
| 50% | 50.2% | 709,004 | 711,368 |
| 40% | 40.0% | 567,203 | 567,409 |
| 30% | 30.0% | 425,402 | 425,730 |
| 20% | 20.0% | 283,601 | 283,346 |
| 10% | 10.0% | 141,801 | 142,423 |
| Active Idle | 0 | 0 | |
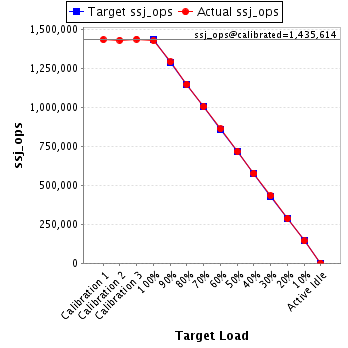
| Target Load | Actual Load | ssj_ops | |
|---|---|---|---|
| Target | Actual | ||
| Calibration 1 | 1,435,394 | ||
| Calibration 2 | 1,432,275 | ||
| Calibration 3 | 1,438,953 | ||
| ssj_ops@calibrated=1,435,614 | |||
| 100% | 99.6% | 1,435,614 | 1,429,258 |
| 90% | 90.0% | 1,292,052 | 1,292,429 |
| 80% | 80.0% | 1,148,491 | 1,148,918 |
| 70% | 70.1% | 1,004,930 | 1,005,765 |
| 60% | 60.1% | 861,368 | 862,229 |
| 50% | 50.0% | 717,807 | 717,296 |
| 40% | 40.1% | 574,246 | 575,996 |
| 30% | 30.1% | 430,684 | 432,372 |
| 20% | 20.0% | 287,123 | 286,769 |
| 10% | 10.0% | 143,561 | 143,750 |
| Active Idle | 0 | 0 | |
| Target Load | Actual Load | ssj_ops | |
|---|---|---|---|
| Target | Actual | ||
| Calibration 1 | 1,443,101 | ||
| Calibration 2 | 1,439,490 | ||
| Calibration 3 | 1,442,002 | ||
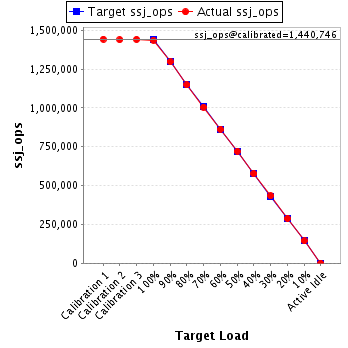
| ssj_ops@calibrated=1,440,746 | |||
| 100% | 99.7% | 1,440,746 | 1,436,865 |
| 90% | 90.1% | 1,296,671 | 1,297,540 |
| 80% | 79.7% | 1,152,597 | 1,148,909 |
| 70% | 69.8% | 1,008,522 | 1,006,227 |
| 60% | 59.9% | 864,448 | 863,412 |
| 50% | 50.1% | 720,373 | 721,577 |
| 40% | 40.0% | 576,298 | 576,105 |
| 30% | 30.1% | 432,224 | 433,172 |
| 20% | 19.9% | 288,149 | 287,212 |
| 10% | 10.0% | 144,075 | 143,965 |
| Active Idle | 0 | 0 | |