SPECpower_ssj2008
Aggregate Performance Report
Copyright © 2007-2019 Standard Performance Evaluation Corporation
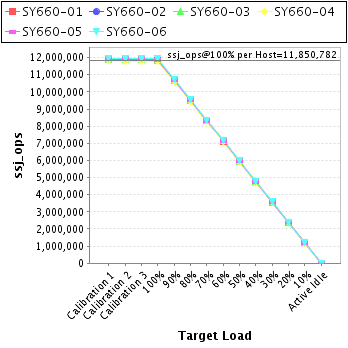
| Hewlett Packard Enterprise Synergy 660 Gen10 Compute Module | ssj_ops@100% = 71,104,692 ssj_ops@100% per Host = 11,850,782 ssj_ops@100% per JVM = 1,481,348 |
||||
| Test Sponsor: | Hewlett Packard Enterprise | SPEC License #: | 3 | Test Method: | Multi Node |
| Tested By: | Hewlett Packard Enterprise | Test Location: | Houston, TX, USA | Test Date: | Mar 10, 2019 |
| Hardware Availability: | Apr-2019 | Software Availability: | Mar-2019 | Publication: | Apr 2, 2019 |
| System Source: | Single Supplier | System Designation: | Server | Power Provisioning: | Line-powered |
| Target Load | Actual Load | ssj_ops | |
|---|---|---|---|
| Target | Actual | ||
| Calibration 1 | 71,404,727 | ||
| Calibration 2 | 71,279,047 | ||
| Calibration 3 | 71,332,049 | ||
| ssj_ops@calibrated=71,305,548 | |||
| 100% | 99.7% | 71,305,548 | 71,104,692 |
| 90% | 89.9% | 64,174,993 | 64,123,464 |
| 80% | 80.0% | 57,044,438 | 57,062,137 |
| 70% | 70.0% | 49,913,883 | 49,893,477 |
| 60% | 60.0% | 42,783,329 | 42,807,981 |
| 50% | 50.0% | 35,652,774 | 35,647,654 |
| 40% | 40.0% | 28,522,219 | 28,518,614 |
| 30% | 30.0% | 21,391,664 | 21,391,386 |
| 20% | 20.0% | 14,261,110 | 14,263,656 |
| 10% | 10.0% | 7,130,555 | 7,127,878 |
| Active Idle | 0 | 0 | |

| # of Nodes | # of Chips | # of Cores | # of Threads | Total RAM (GB) | # of OS Images | # of JVM Instances |
|---|---|---|---|---|---|---|
| 6 | 24 | 672 | 1,344 | 2,304 | 6 | 48 |
| Set Identifier: | SUT |
| Set Description: | System Under Test |
| # of Identical Nodes: | 6 |
| Comment: | SUT |
| Hardware per Node | |
|---|---|
| Hardware Vendor: | Hewlett Packard Enterprise |
| Model: | Synergy 660 Gen10 Compute Module |
| Form Factor: | blade |
| CPU Name: | Intel Xeon Platinum 8280 @ 2.70GHz |
| CPU Characteristics: | 28-Core, 2.70 GHz, 38.5MB L3 Cache |
| CPU Frequency (MHz): | 2700 |
| CPU(s) Enabled: | 112 cores, 4 chips, 28 cores/chip |
| Hardware Threads: | 224 (2 / core) |
| CPU(s) Orderable: | 1,2,3,4 chips |
| Primary Cache: | 32 KB I + 32 KB D on chip per core |
| Secondary Cache: | 1 MB I+D on chip per core |
| Tertiary Cache: | 39424 KB I+D on chip per chip |
| Other Cache: | None |
| Memory Amount (GB): | 384 |
| # and size of DIMM: | 24 x 16384 MB |
| Memory Details: | 24 x 16GB 2Rx8 PC4-2933Y-R; slots 1, 3, 5, 8, 10 and 12 populated on each socket |
| Power Supply Quantity and Rating (W): | None |
| Power Supply Details: | N/A |
| Disk Drive: | 1 x HPE 480GB SATA 6G M.2 2280 (875498-B21) |
| Disk Controller: | HPE Smart Array S100i SR Gen10 |
| # and type of Network Interface Cards (NICs) Installed: | 1 x HPE Synergy 3820C 10/20Gb CNA |
| NICs Enabled in Firmware / OS / Connected: | 2/2/1 |
| Network Speed (Mbit): | 1000 |
| Keyboard: | None |
| Mouse: | None |
| Monitor: | None |
| Optical Drives: | No |
| Other Hardware: | None |
| Software per Node | |
|---|---|
| Power Management: | Enabled (see SUT Notes) |
| Operating System (OS): | SUSE Linux Enterprise Server 12 SP4 |
| OS Version: | 4.12.14-94.41-default |
| Filesystem: | NTFS |
| JVM Vendor: | Oracle Corporation |
| JVM Version: | Oracle Java HotSpot(TM) 64-Bit Server VM (build 24.80-b11, mixed mode), version 1.7.0_80 |
| JVM Command-line Options: | -server -Xmn19000m -Xms21000m -Xmx21000m -XX:SurvivorRatio=1 -XX:TargetSurvivorRatio=99 -XX:AllocatePrefetchDistance=256 -XX:AllocatePrefetchLines=4 -XX:LoopUnrollLimit=45 -XX:InitialTenuringThreshold=12 -XX:MaxTenuringThreshold=15 -XX:ParallelGCThreads=28 -XX:InlineSmallCode=3900 -XX:MaxInlineSize=270 -XX:FreqInlineSize=2500 -XX:+AggressiveOpts -XX:+UseLargePages -XX:+UseParallelOldGC |
| JVM Affinity: | start /NODE [0,1,2,3] /AFFINITY [0xFFFFFFF] |
| JVM Instances: | 8 |
| JVM Initial Heap (MB): | 21000 |
| JVM Maximum Heap (MB): | 21000 |
| JVM Address Bits: | 64 |
| Boot Firmware Version: | I43 v2.10 (01/18/2019) |
| Management Firmware Version: | 1.40 Feb 05 2019 |
| Workload Version: | SSJ 1.2.10 |
| Director Location: | Controller |
| Other Software: | HPE Service Pack for ProLiant (SPP) - Version 2019.03.0 (Mar 2019) |
| Host | ssj_ops@100% |
|---|---|
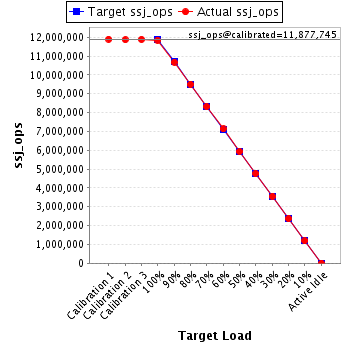
| SY660-01 | 11,844,553 |
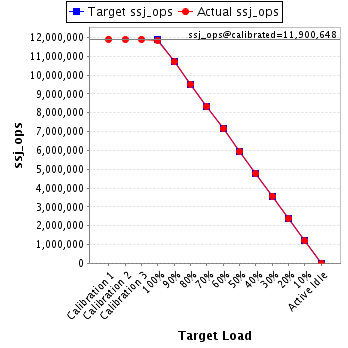
| SY660-02 | 11,856,126 |
| SY660-03 | 11,851,354 |
| SY660-04 | 11,754,703 |
| SY660-05 | 11,874,320 |
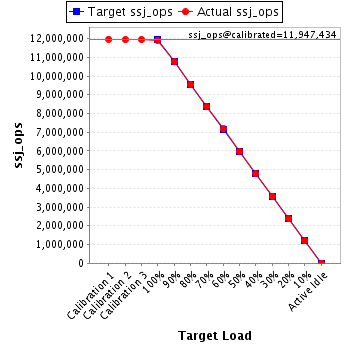
| SY660-06 | 11,923,636 |
| ssj_ops@100% | 71,104,692 |
| ssj_ops@100% per Host | 11,850,782 |
| ssj_ops@100% per JVM | 1,481,348 |
| Target Load | Actual Load | ssj_ops | |
|---|---|---|---|
| Target | Actual | ||
| Calibration 1 | 11,898,030 | ||
| Calibration 2 | 11,866,794 | ||
| Calibration 3 | 11,888,697 | ||
| ssj_ops@calibrated=11,877,745 | |||
| 100% | 99.7% | 11,877,745 | 11,844,553 |
| 90% | 89.9% | 10,689,971 | 10,681,719 |
| 80% | 80.0% | 9,502,196 | 9,505,702 |
| 70% | 70.0% | 8,314,422 | 8,316,648 |
| 60% | 60.0% | 7,126,647 | 7,130,517 |
| 50% | 50.0% | 5,938,873 | 5,943,321 |
| 40% | 40.1% | 4,751,098 | 4,758,506 |
| 30% | 30.0% | 3,563,324 | 3,558,853 |
| 20% | 20.0% | 2,375,549 | 2,371,904 |
| 10% | 10.0% | 1,187,775 | 1,190,513 |
| Active Idle | 0 | 0 | |
| Target Load | Actual Load | ssj_ops | |
|---|---|---|---|
| Target | Actual | ||
| Calibration 1 | 11,914,952 | ||
| Calibration 2 | 11,900,416 | ||
| Calibration 3 | 11,900,879 | ||
| ssj_ops@calibrated=11,900,648 | |||
| 100% | 99.6% | 11,900,648 | 11,856,126 |
| 90% | 90.0% | 10,710,583 | 10,705,621 |
| 80% | 80.1% | 9,520,518 | 9,526,856 |
| 70% | 70.0% | 8,330,453 | 8,334,790 |
| 60% | 60.0% | 7,140,389 | 7,141,989 |
| 50% | 50.0% | 5,950,324 | 5,946,201 |
| 40% | 40.0% | 4,760,259 | 4,763,786 |
| 30% | 30.0% | 3,570,194 | 3,573,846 |
| 20% | 20.0% | 2,380,130 | 2,380,980 |
| 10% | 10.0% | 1,190,065 | 1,186,652 |
| Active Idle | 0 | 0 | |
| Target Load | Actual Load | ssj_ops | |
|---|---|---|---|
| Target | Actual | ||
| Calibration 1 | 11,903,931 | ||
| Calibration 2 | 11,887,363 | ||
| Calibration 3 | 11,884,875 | ||
| ssj_ops@calibrated=11,886,119 | |||
| 100% | 99.7% | 11,886,119 | 11,851,354 |
| 90% | 90.0% | 10,697,507 | 10,693,019 |
| 80% | 80.1% | 9,508,895 | 9,518,146 |
| 70% | 69.9% | 8,320,283 | 8,314,321 |
| 60% | 60.0% | 7,131,671 | 7,135,774 |
| 50% | 50.0% | 5,943,060 | 5,940,401 |
| 40% | 39.9% | 4,754,448 | 4,747,511 |
| 30% | 30.0% | 3,565,836 | 3,562,400 |
| 20% | 20.0% | 2,377,224 | 2,380,422 |
| 10% | 10.0% | 1,188,612 | 1,189,942 |
| Active Idle | 0 | 0 | |

| Target Load | Actual Load | ssj_ops | |
|---|---|---|---|
| Target | Actual | ||
| Calibration 1 | 11,806,131 | ||
| Calibration 2 | 11,783,279 | ||
| Calibration 3 | 11,796,936 | ||
| ssj_ops@calibrated=11,790,107 | |||
| 100% | 99.7% | 11,790,107 | 11,754,703 |
| 90% | 89.9% | 10,611,097 | 10,604,514 |
| 80% | 80.0% | 9,432,086 | 9,432,021 |
| 70% | 69.9% | 8,253,075 | 8,243,904 |
| 60% | 60.0% | 7,074,064 | 7,077,007 |
| 50% | 50.0% | 5,895,054 | 5,890,870 |
| 40% | 40.0% | 4,716,043 | 4,714,052 |
| 30% | 30.0% | 3,537,032 | 3,537,654 |
| 20% | 20.0% | 2,358,021 | 2,357,178 |
| 10% | 10.0% | 1,179,011 | 1,179,045 |
| Active Idle | 0 | 0 | |

| Target Load | Actual Load | ssj_ops | |
|---|---|---|---|
| Target | Actual | ||
| Calibration 1 | 11,913,328 | ||
| Calibration 2 | 11,899,421 | ||
| Calibration 3 | 11,907,569 | ||
| ssj_ops@calibrated=11,903,495 | |||
| 100% | 99.8% | 11,903,495 | 11,874,320 |
| 90% | 89.8% | 10,713,145 | 10,688,302 |
| 80% | 80.0% | 9,522,796 | 9,526,111 |
| 70% | 70.0% | 8,332,446 | 8,327,214 |
| 60% | 60.1% | 7,142,097 | 7,149,664 |
| 50% | 50.0% | 5,951,747 | 5,955,034 |
| 40% | 40.0% | 4,761,398 | 4,759,480 |
| 30% | 30.0% | 3,571,048 | 3,575,163 |
| 20% | 20.0% | 2,380,699 | 2,386,603 |
| 10% | 10.0% | 1,190,349 | 1,188,560 |
| Active Idle | 0 | 0 | |

| Target Load | Actual Load | ssj_ops | |
|---|---|---|---|
| Target | Actual | ||
| Calibration 1 | 11,968,356 | ||
| Calibration 2 | 11,941,774 | ||
| Calibration 3 | 11,953,094 | ||
| ssj_ops@calibrated=11,947,434 | |||
| 100% | 99.8% | 11,947,434 | 11,923,636 |
| 90% | 90.0% | 10,752,690 | 10,750,289 |
| 80% | 80.0% | 9,557,947 | 9,553,300 |
| 70% | 69.9% | 8,363,204 | 8,356,600 |
| 60% | 60.0% | 7,168,460 | 7,173,029 |
| 50% | 50.0% | 5,973,717 | 5,971,827 |
| 40% | 40.0% | 4,778,973 | 4,775,278 |
| 30% | 30.0% | 3,584,230 | 3,583,470 |
| 20% | 20.0% | 2,389,487 | 2,386,569 |
| 10% | 10.0% | 1,194,743 | 1,193,166 |
| Active Idle | 0 | 0 | |