SPECpower_ssj2008
Aggregate Performance Report
Copyright © 2007-2019 Standard Performance Evaluation Corporation
| Hewlett Packard Enterprise Synergy 660 Gen10 Compute Module | ssj_ops@100% = 59,083,703 ssj_ops@100% per Host = 11,816,741 ssj_ops@100% per JVM = 1,477,093 |
||||
| Test Sponsor: | Hewlett Packard Enterprise | SPEC License #: | 3 | Test Method: | Multi Node |
| Tested By: | Hewlett Packard Enterprise | Test Location: | Houston, TX, USA | Test Date: | Mar 10, 2019 |
| Hardware Availability: | Apr-2019 | Software Availability: | Mar-2019 | Publication: | Apr 2, 2019 |
| System Source: | Single Supplier | System Designation: | Server | Power Provisioning: | Line-powered |
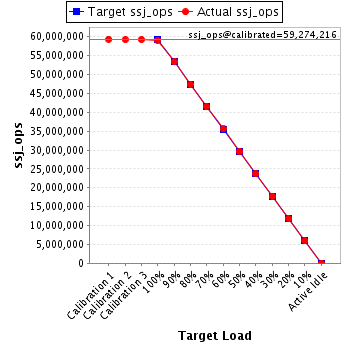
| Target Load | Actual Load | ssj_ops | |
|---|---|---|---|
| Target | Actual | ||
| Calibration 1 | 59,376,142 | ||
| Calibration 2 | 59,250,594 | ||
| Calibration 3 | 59,297,838 | ||
| ssj_ops@calibrated=59,274,216 | |||
| 100% | 99.7% | 59,274,216 | 59,083,703 |
| 90% | 90.0% | 53,346,794 | 53,366,397 |
| 80% | 80.0% | 47,419,373 | 47,445,936 |
| 70% | 70.0% | 41,491,951 | 41,490,843 |
| 60% | 60.0% | 35,564,530 | 35,584,739 |
| 50% | 50.0% | 29,637,108 | 29,650,784 |
| 40% | 40.0% | 23,709,686 | 23,728,901 |
| 30% | 30.0% | 17,782,265 | 17,779,460 |
| 20% | 20.0% | 11,854,843 | 11,861,158 |
| 10% | 10.0% | 5,927,422 | 5,923,948 |
| Active Idle | 0 | 0 | |
| # of Nodes | # of Chips | # of Cores | # of Threads | Total RAM (GB) | # of OS Images | # of JVM Instances |
|---|---|---|---|---|---|---|
| 5 | 20 | 560 | 1,120 | 1,920 | 5 | 40 |
| Set Identifier: | SUT |
| Set Description: | System Under Test |
| # of Identical Nodes: | 5 |
| Comment: | SUT |
| Hardware per Node | |
|---|---|
| Hardware Vendor: | Hewlett Packard Enterprise |
| Model: | Synergy 660 Gen10 Compute Module |
| Form Factor: | blade |
| CPU Name: | Intel Xeon Platinum 8280 @ 2.70GHz |
| CPU Characteristics: | 28-Core, 2.70 GHz, 38.5MB L3 Cache |
| CPU Frequency (MHz): | 2700 |
| CPU(s) Enabled: | 112 cores, 4 chips, 28 cores/chip |
| Hardware Threads: | 224 (2 / core) |
| CPU(s) Orderable: | 1,2,3,4 chips |
| Primary Cache: | 32 KB I + 32 KB D on chip per core |
| Secondary Cache: | 1 MB I+D on chip per core |
| Tertiary Cache: | 39424 KB I+D on chip per chip |
| Other Cache: | None |
| Memory Amount (GB): | 384 |
| # and size of DIMM: | 24 x 16384 MB |
| Memory Details: | 24 x 16GB 2Rx8 PC4-2933Y-R; slots 1, 3, 5, 8, 10 and 12 populated on each socket |
| Power Supply Quantity and Rating (W): | None |
| Power Supply Details: | N/A |
| Disk Drive: | 1 x HPE 480GB SATA 6G M.2 2280 (875498-B21) |
| Disk Controller: | HPE Smart Array S100i SR Gen10 |
| # and type of Network Interface Cards (NICs) Installed: | 1 x HPE Synergy 3820C 10/20Gb CNA |
| NICs Enabled in Firmware / OS / Connected: | 2/2/1 |
| Network Speed (Mbit): | 1000 |
| Keyboard: | None |
| Mouse: | None |
| Monitor: | None |
| Optical Drives: | No |
| Other Hardware: | None |
| Software per Node | |
|---|---|
| Power Management: | Enabled (see SUT Notes) |
| Operating System (OS): | SUSE Linux Enterprise Server 12 SP4 |
| OS Version: | 4.12.14-94.41-default |
| Filesystem: | NTFS |
| JVM Vendor: | Oracle Corporation |
| JVM Version: | Oracle Java HotSpot(TM) 64-Bit Server VM (build 24.80-b11, mixed mode), version 1.7.0_80 |
| JVM Command-line Options: | -server -Xmn19000m -Xms21000m -Xmx21000m -XX:SurvivorRatio=1 -XX:TargetSurvivorRatio=99 -XX:AllocatePrefetchDistance=256 -XX:AllocatePrefetchLines=4 -XX:LoopUnrollLimit=45 -XX:InitialTenuringThreshold=12 -XX:MaxTenuringThreshold=15 -XX:ParallelGCThreads=28 -XX:InlineSmallCode=3900 -XX:MaxInlineSize=270 -XX:FreqInlineSize=2500 -XX:+AggressiveOpts -XX:+UseLargePages -XX:+UseParallelOldGC |
| JVM Affinity: | start /NODE [0,1,2,3] /AFFINITY [0xFFFFFFF] |
| JVM Instances: | 8 |
| JVM Initial Heap (MB): | 21000 |
| JVM Maximum Heap (MB): | 21000 |
| JVM Address Bits: | 64 |
| Boot Firmware Version: | I43 v2.10 (01/18/2019) |
| Management Firmware Version: | 1.40 Feb 05 2019 |
| Workload Version: | SSJ 1.2.10 |
| Director Location: | Controller |
| Other Software: | HPE Service Pack for ProLiant (SPP) - Version 2019.03.0 (Mar 2019) |
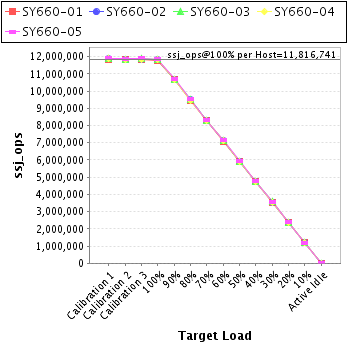
| Host | ssj_ops@100% |
|---|---|
| SY660-01 | 11,793,550 |
| SY660-02 | 11,804,714 |
| SY660-03 | 11,827,661 |
| SY660-04 | 11,814,768 |
| SY660-05 | 11,843,010 |
| ssj_ops@100% | 59,083,703 |
| ssj_ops@100% per Host | 11,816,741 |
| ssj_ops@100% per JVM | 1,477,093 |
| Target Load | Actual Load | ssj_ops | |
|---|---|---|---|
| Target | Actual | ||
| Calibration 1 | 11,842,759 | ||
| Calibration 2 | 11,821,358 | ||
| Calibration 3 | 11,834,238 | ||
| ssj_ops@calibrated=11,827,798 | |||
| 100% | 99.7% | 11,827,798 | 11,793,550 |
| 90% | 90.0% | 10,645,018 | 10,650,844 |
| 80% | 80.1% | 9,462,238 | 9,471,304 |
| 70% | 70.0% | 8,279,459 | 8,285,121 |
| 60% | 60.0% | 7,096,679 | 7,098,398 |
| 50% | 50.0% | 5,913,899 | 5,916,253 |
| 40% | 40.0% | 4,731,119 | 4,729,379 |
| 30% | 30.0% | 3,548,339 | 3,542,459 |
| 20% | 20.0% | 2,365,560 | 2,370,679 |
| 10% | 10.0% | 1,182,780 | 1,182,647 |
| Active Idle | 0 | 0 | |

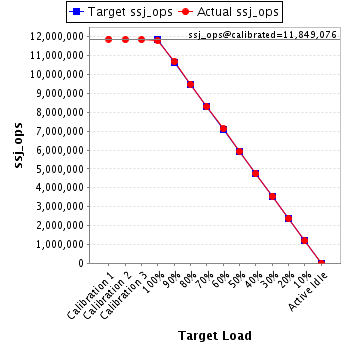
| Target Load | Actual Load | ssj_ops | |
|---|---|---|---|
| Target | Actual | ||
| Calibration 1 | 11,874,150 | ||
| Calibration 2 | 11,847,259 | ||
| Calibration 3 | 11,850,893 | ||
| ssj_ops@calibrated=11,849,076 | |||
| 100% | 99.6% | 11,849,076 | 11,804,714 |
| 90% | 90.0% | 10,664,168 | 10,669,723 |
| 80% | 80.1% | 9,479,261 | 9,488,943 |
| 70% | 70.0% | 8,294,353 | 8,295,527 |
| 60% | 60.1% | 7,109,445 | 7,122,379 |
| 50% | 50.1% | 5,924,538 | 5,930,968 |
| 40% | 40.0% | 4,739,630 | 4,744,249 |
| 30% | 30.0% | 3,554,723 | 3,555,860 |
| 20% | 20.0% | 2,369,815 | 2,369,178 |
| 10% | 10.0% | 1,184,908 | 1,184,764 |
| Active Idle | 0 | 0 | |
| Target Load | Actual Load | ssj_ops | |
|---|---|---|---|
| Target | Actual | ||
| Calibration 1 | 11,885,598 | ||
| Calibration 2 | 11,861,904 | ||
| Calibration 3 | 11,868,608 | ||
| ssj_ops@calibrated=11,865,256 | |||
| 100% | 99.7% | 11,865,256 | 11,827,661 |
| 90% | 89.9% | 10,678,731 | 10,671,669 |
| 80% | 80.0% | 9,492,205 | 9,493,174 |
| 70% | 70.0% | 8,305,679 | 8,306,111 |
| 60% | 60.0% | 7,119,154 | 7,122,453 |
| 50% | 50.0% | 5,932,628 | 5,931,153 |
| 40% | 40.1% | 4,746,102 | 4,753,876 |
| 30% | 30.1% | 3,559,577 | 3,565,566 |
| 20% | 20.0% | 2,373,051 | 2,371,443 |
| 10% | 10.0% | 1,186,526 | 1,188,460 |
| Active Idle | 0 | 0 | |

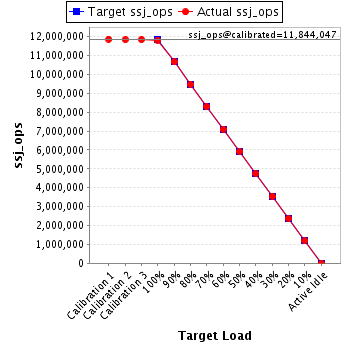
| Target Load | Actual Load | ssj_ops | |
|---|---|---|---|
| Target | Actual | ||
| Calibration 1 | 11,863,718 | ||
| Calibration 2 | 11,842,583 | ||
| Calibration 3 | 11,845,511 | ||
| ssj_ops@calibrated=11,844,047 | |||
| 100% | 99.8% | 11,844,047 | 11,814,768 |
| 90% | 90.0% | 10,659,642 | 10,659,983 |
| 80% | 80.0% | 9,475,238 | 9,477,728 |
| 70% | 70.0% | 8,290,833 | 8,288,384 |
| 60% | 60.0% | 7,106,428 | 7,101,947 |
| 50% | 50.0% | 5,922,024 | 5,922,732 |
| 40% | 40.0% | 4,737,619 | 4,739,616 |
| 30% | 30.0% | 3,553,214 | 3,553,309 |
| 20% | 20.0% | 2,368,809 | 2,369,661 |
| 10% | 10.0% | 1,184,405 | 1,181,034 |
| Active Idle | 0 | 0 | |
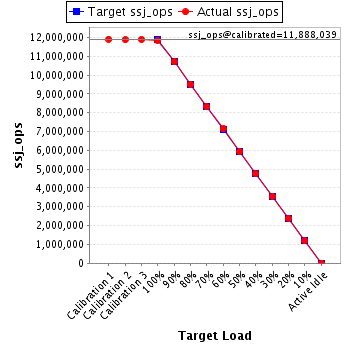
| Target Load | Actual Load | ssj_ops | |
|---|---|---|---|
| Target | Actual | ||
| Calibration 1 | 11,909,917 | ||
| Calibration 2 | 11,877,490 | ||
| Calibration 3 | 11,898,589 | ||
| ssj_ops@calibrated=11,888,039 | |||
| 100% | 99.6% | 11,888,039 | 11,843,010 |
| 90% | 90.1% | 10,699,235 | 10,714,179 |
| 80% | 80.0% | 9,510,431 | 9,514,787 |
| 70% | 70.0% | 8,321,627 | 8,315,700 |
| 60% | 60.1% | 7,132,823 | 7,139,562 |
| 50% | 50.0% | 5,944,020 | 5,949,680 |
| 40% | 40.1% | 4,755,216 | 4,761,781 |
| 30% | 30.0% | 3,566,412 | 3,562,266 |
| 20% | 20.0% | 2,377,608 | 2,380,197 |
| 10% | 10.0% | 1,188,804 | 1,187,044 |
| Active Idle | 0 | 0 | |