SPECpower_ssj2008
Host 'SY480-02' Performance Report
Copyright © 2007-2019 Standard Performance Evaluation Corporation
| Hewlett Packard Enterprise Synergy 480 Gen10 Compute Module | ssj_ops@100% = 5,905,864 ssj_ops@100% per JVM = 1,476,466 |
||||
| Test Sponsor: | Hewlett Packard Enterprise | SPEC License #: | 3 | Test Method: | Multi Node |
| Tested By: | Hewlett Packard Enterprise | Test Location: | Houston, TX, USA | Test Date: | Mar 12, 2019 |
| Hardware Availability: | Apr-2019 | Software Availability: | Mar-2019 | Publication: | Apr 2, 2019 |
| System Source: | Single Supplier | System Designation: | Server | Power Provisioning: | Line-powered |
| Target Load | Actual Load | ssj_ops | |
|---|---|---|---|
| Target | Actual | ||
| Calibration 1 | 5,927,787 | ||
| Calibration 2 | 5,916,509 | ||
| Calibration 3 | 5,918,973 | ||
| ssj_ops@calibrated=5,917,741 | |||
| 100% | 99.8% | 5,917,741 | 5,905,864 |
| 90% | 89.9% | 5,325,967 | 5,320,258 |
| 80% | 80.1% | 4,734,193 | 4,742,034 |
| 70% | 70.0% | 4,142,419 | 4,143,987 |
| 60% | 60.1% | 3,550,645 | 3,557,741 |
| 50% | 50.0% | 2,958,870 | 2,958,564 |
| 40% | 40.0% | 2,367,096 | 2,369,984 |
| 30% | 30.0% | 1,775,322 | 1,776,160 |
| 20% | 20.0% | 1,183,548 | 1,185,763 |
| 10% | 10.0% | 591,774 | 591,959 |
| Active Idle | 0 | 0 | |

| Set Identifier: | SUT |
| Set Description: | System Under Test |
| # of Identical Nodes: | 10 |
| Comment: | SUT |
| Hardware | |
|---|---|
| Hardware Vendor: | Hewlett Packard Enterprise |
| Model: | Synergy 480 Gen10 Compute Module |
| Form Factor: | blade |
| CPU Name: | Intel Xeon Platinum 8280 @ 2.70GHz |
| CPU Characteristics: | 28-Core, 2.70 GHz, 38.5MB L3 Cache |
| CPU Frequency (MHz): | 2700 |
| CPU(s) Enabled: | 56 cores, 2 chips, 28 cores/chip |
| Hardware Threads: | 112 (2 / core) |
| CPU(s) Orderable: | 1,2 chips |
| Primary Cache: | 32 KB I + 32 KB D on chip per core |
| Secondary Cache: | 1 MB I+D on chip per core |
| Tertiary Cache: | 39424 KB I+D on chip per chip |
| Other Cache: | None |
| Memory Amount (GB): | 192 |
| # and size of DIMM: | 12 x 16384 MB |
| Memory Details: | 12 x 16GB 2Rx8 PC4-2933Y-R; slots 1, 3, 5, 8, 10 and 12 populated on each socket |
| Power Supply Quantity and Rating (W): | None |
| Power Supply Details: | N/A |
| Disk Drive: | 1 x HPE 480GB SATA 6G M.2 2280 (875498-B21) |
| Disk Controller: | HPE Smart Array S100i SR Gen10 |
| # and type of Network Interface Cards (NICs) Installed: | 1 x HPE Synergy 3820C 10/20Gb CNA |
| NICs Enabled in Firmware / OS / Connected: | 2/2/1 |
| Network Speed (Mbit): | 1000 |
| Keyboard: | None |
| Mouse: | None |
| Monitor: | None |
| Optical Drives: | No |
| Other Hardware: | None |
| Software | |
|---|---|
| Power Management: | Enabled (see SUT Notes) |
| Operating System (OS): | SUSE Linux Enterprise Server 12 SP4 |
| OS Version: | 4.12.14-94.41-default |
| Filesystem: | xfs |
| JVM Vendor: | Oracle Corporation |
| JVM Version: | Oracle Java HotSpot(TM) 64-Bit Server VM (build 24.80-b11, mixed mode), version 1.7.0_80 |
| JVM Command-line Options: | -server -Xmn19g -Xms21g -Xmx21g -XX:SurvivorRatio=1 -XX:TargetSurvivorRatio=99 -XX:AllocatePrefetchDistance=384 -XX:AllocatePrefetchLines=4 -XX:LoopUnrollLimit=37 -XX:InitialTenuringThreshold=12 -XX:MaxTenuringThreshold=15 -XX:ParallelGCThreads=28 -XX:InlineSmallCode=3900 -XX:MaxInlineSize=270 -XX:FreqInlineSize=2500 -XX:+AggressiveOpts -XX:+UseLargePages -XX:+UseParallelOldGC |
| JVM Affinity: | numactl --cpunodebind=[0-3] --localalloc |
| JVM Instances: | 4 |
| JVM Initial Heap (MB): | 21000 |
| JVM Maximum Heap (MB): | 21000 |
| JVM Address Bits: | 64 |
| Boot Firmware Version: | I42 v2.00 (02/02/2019) |
| Management Firmware Version: | 1.40 Feb 05 2019 |
| Workload Version: | SSJ 1.2.10 |
| Director Location: | Controller |
| Other Software: | HPE Service Pack for ProLiant (SPP) - Version 2019.03.0 (Mar 2019) |
| JVM Instance | ssj_ops@100% |
|---|---|
| SY480-02.001 | 1,469,436 |
| SY480-02.002 | 1,485,108 |
| SY480-02.003 | 1,468,692 |
| SY480-02.004 | 1,482,628 |
| ssj_ops@100% | 5,905,864 |
| ssj_ops@100% per JVM | 1,476,466 |

| Target Load | Actual Load | ssj_ops | |
|---|---|---|---|
| Target | Actual | ||
| Calibration 1 | 1,475,674 | ||
| Calibration 2 | 1,472,814 | ||
| Calibration 3 | 1,472,288 | ||
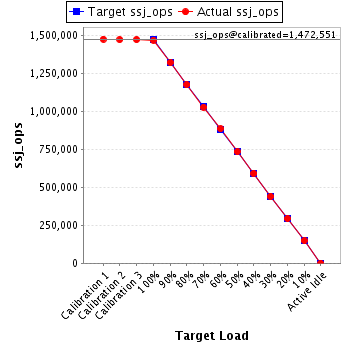
| ssj_ops@calibrated=1,472,551 | |||
| 100% | 99.8% | 1,472,551 | 1,469,436 |
| 90% | 89.8% | 1,325,296 | 1,322,837 |
| 80% | 79.9% | 1,178,041 | 1,176,372 |
| 70% | 69.9% | 1,030,786 | 1,028,920 |
| 60% | 60.2% | 883,531 | 885,965 |
| 50% | 49.9% | 736,275 | 734,326 |
| 40% | 40.2% | 589,020 | 591,383 |
| 30% | 29.9% | 441,765 | 440,734 |
| 20% | 20.0% | 294,510 | 294,179 |
| 10% | 10.1% | 147,255 | 149,134 |
| Active Idle | 0 | 0 | |
| Target Load | Actual Load | ssj_ops | |
|---|---|---|---|
| Target | Actual | ||
| Calibration 1 | 1,490,355 | ||
| Calibration 2 | 1,488,458 | ||
| Calibration 3 | 1,489,050 | ||
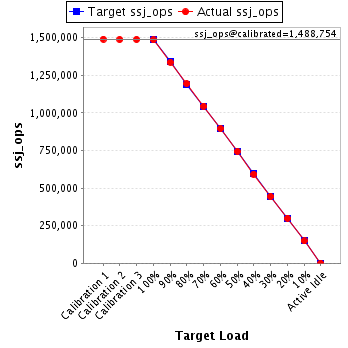
| ssj_ops@calibrated=1,488,754 | |||
| 100% | 99.8% | 1,488,754 | 1,485,108 |
| 90% | 89.8% | 1,339,879 | 1,336,882 |
| 80% | 80.3% | 1,191,003 | 1,194,905 |
| 70% | 70.2% | 1,042,128 | 1,045,816 |
| 60% | 60.1% | 893,253 | 895,406 |
| 50% | 50.0% | 744,377 | 743,873 |
| 40% | 39.8% | 595,502 | 593,084 |
| 30% | 29.9% | 446,626 | 444,417 |
| 20% | 20.2% | 297,751 | 300,193 |
| 10% | 10.0% | 148,875 | 148,250 |
| Active Idle | 0 | 0 | |
| Target Load | Actual Load | ssj_ops | |
|---|---|---|---|
| Target | Actual | ||
| Calibration 1 | 1,473,042 | ||
| Calibration 2 | 1,469,999 | ||
| Calibration 3 | 1,471,127 | ||
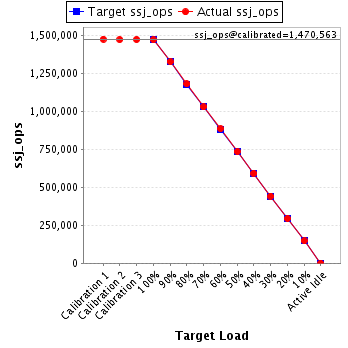
| ssj_ops@calibrated=1,470,563 | |||
| 100% | 99.9% | 1,470,563 | 1,468,692 |
| 90% | 90.1% | 1,323,507 | 1,324,504 |
| 80% | 80.2% | 1,176,450 | 1,178,955 |
| 70% | 69.9% | 1,029,394 | 1,027,530 |
| 60% | 60.1% | 882,338 | 884,152 |
| 50% | 49.9% | 735,282 | 733,414 |
| 40% | 40.2% | 588,225 | 590,556 |
| 30% | 30.0% | 441,169 | 441,844 |
| 20% | 20.0% | 294,113 | 293,710 |
| 10% | 10.0% | 147,056 | 147,025 |
| Active Idle | 0 | 0 | |
| Target Load | Actual Load | ssj_ops | |
|---|---|---|---|
| Target | Actual | ||
| Calibration 1 | 1,488,716 | ||
| Calibration 2 | 1,485,238 | ||
| Calibration 3 | 1,486,508 | ||
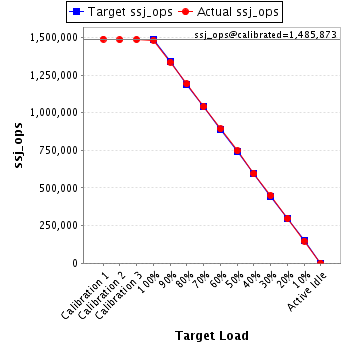
| ssj_ops@calibrated=1,485,873 | |||
| 100% | 99.8% | 1,485,873 | 1,482,628 |
| 90% | 89.9% | 1,337,285 | 1,336,034 |
| 80% | 80.2% | 1,188,698 | 1,191,802 |
| 70% | 70.1% | 1,040,111 | 1,041,721 |
| 60% | 60.0% | 891,524 | 892,218 |
| 50% | 50.3% | 742,936 | 746,950 |
| 40% | 40.0% | 594,349 | 594,962 |
| 30% | 30.2% | 445,762 | 449,165 |
| 20% | 20.0% | 297,175 | 297,682 |
| 10% | 9.9% | 148,587 | 147,551 |
| Active Idle | 0 | 0 | |