
SPECpower_ssj2008
Host 'SY480-06' Performance Report
Copyright © 2007-2019 Standard Performance Evaluation Corporation
| Hewlett Packard Enterprise Synergy 480 Gen10 Compute Module | ssj_ops@100% = 5,925,160 ssj_ops@100% per JVM = 1,481,290 |
||||
| Test Sponsor: | Hewlett Packard Enterprise | SPEC License #: | 3 | Test Method: | Multi Node |
| Tested By: | Hewlett Packard Enterprise | Test Location: | Houston, TX, USA | Test Date: | Mar 12, 2019 |
| Hardware Availability: | Apr-2019 | Software Availability: | Mar-2019 | Publication: | Apr 2, 2019 |
| System Source: | Single Supplier | System Designation: | Server | Power Provisioning: | Line-powered |
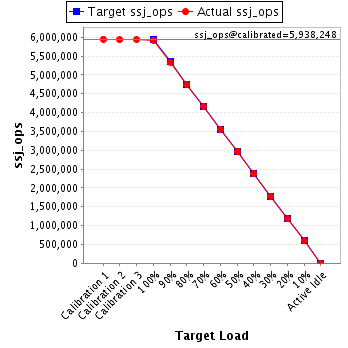
| Target Load | Actual Load | ssj_ops | |
|---|---|---|---|
| Target | Actual | ||
| Calibration 1 | 5,949,010 | ||
| Calibration 2 | 5,934,753 | ||
| Calibration 3 | 5,941,744 | ||
| ssj_ops@calibrated=5,938,248 | |||
| 100% | 99.8% | 5,938,248 | 5,925,160 |
| 90% | 89.9% | 5,344,424 | 5,338,729 |
| 80% | 79.9% | 4,750,599 | 4,741,980 |
| 70% | 70.1% | 4,156,774 | 4,162,612 |
| 60% | 60.0% | 3,562,949 | 3,561,290 |
| 50% | 50.0% | 2,969,124 | 2,968,014 |
| 40% | 40.0% | 2,375,299 | 2,375,876 |
| 30% | 30.0% | 1,781,475 | 1,783,229 |
| 20% | 20.0% | 1,187,650 | 1,185,690 |
| 10% | 10.0% | 593,825 | 592,728 |
| Active Idle | 0 | 0 | |
| Set Identifier: | SUT |
| Set Description: | System Under Test |
| # of Identical Nodes: | 10 |
| Comment: | SUT |
| Hardware | |
|---|---|
| Hardware Vendor: | Hewlett Packard Enterprise |
| Model: | Synergy 480 Gen10 Compute Module |
| Form Factor: | blade |
| CPU Name: | Intel Xeon Platinum 8280 @ 2.70GHz |
| CPU Characteristics: | 28-Core, 2.70 GHz, 38.5MB L3 Cache |
| CPU Frequency (MHz): | 2700 |
| CPU(s) Enabled: | 56 cores, 2 chips, 28 cores/chip |
| Hardware Threads: | 112 (2 / core) |
| CPU(s) Orderable: | 1,2 chips |
| Primary Cache: | 32 KB I + 32 KB D on chip per core |
| Secondary Cache: | 1 MB I+D on chip per core |
| Tertiary Cache: | 39424 KB I+D on chip per chip |
| Other Cache: | None |
| Memory Amount (GB): | 192 |
| # and size of DIMM: | 12 x 16384 MB |
| Memory Details: | 12 x 16GB 2Rx8 PC4-2933Y-R; slots 1, 3, 5, 8, 10 and 12 populated on each socket |
| Power Supply Quantity and Rating (W): | None |
| Power Supply Details: | N/A |
| Disk Drive: | 1 x HPE 480GB SATA 6G M.2 2280 (875498-B21) |
| Disk Controller: | HPE Smart Array S100i SR Gen10 |
| # and type of Network Interface Cards (NICs) Installed: | 1 x HPE Synergy 3820C 10/20Gb CNA |
| NICs Enabled in Firmware / OS / Connected: | 2/2/1 |
| Network Speed (Mbit): | 1000 |
| Keyboard: | None |
| Mouse: | None |
| Monitor: | None |
| Optical Drives: | No |
| Other Hardware: | None |
| Software | |
|---|---|
| Power Management: | Enabled (see SUT Notes) |
| Operating System (OS): | SUSE Linux Enterprise Server 12 SP4 |
| OS Version: | 4.12.14-94.41-default |
| Filesystem: | xfs |
| JVM Vendor: | Oracle Corporation |
| JVM Version: | Oracle Java HotSpot(TM) 64-Bit Server VM (build 24.80-b11, mixed mode), version 1.7.0_80 |
| JVM Command-line Options: | -server -Xmn19g -Xms21g -Xmx21g -XX:SurvivorRatio=1 -XX:TargetSurvivorRatio=99 -XX:AllocatePrefetchDistance=384 -XX:AllocatePrefetchLines=4 -XX:LoopUnrollLimit=37 -XX:InitialTenuringThreshold=12 -XX:MaxTenuringThreshold=15 -XX:ParallelGCThreads=28 -XX:InlineSmallCode=3900 -XX:MaxInlineSize=270 -XX:FreqInlineSize=2500 -XX:+AggressiveOpts -XX:+UseLargePages -XX:+UseParallelOldGC |
| JVM Affinity: | numactl --cpunodebind=[0-3] --localalloc |
| JVM Instances: | 4 |
| JVM Initial Heap (MB): | 21000 |
| JVM Maximum Heap (MB): | 21000 |
| JVM Address Bits: | 64 |
| Boot Firmware Version: | I42 v2.00 (02/02/2019) |
| Management Firmware Version: | 1.40 Feb 05 2019 |
| Workload Version: | SSJ 1.2.10 |
| Director Location: | Controller |
| Other Software: | HPE Service Pack for ProLiant (SPP) - Version 2019.03.0 (Mar 2019) |
| JVM Instance | ssj_ops@100% |
|---|---|
| SY480-06.001 | 1,484,900 |
| SY480-06.002 | 1,469,608 |
| SY480-06.003 | 1,470,759 |
| SY480-06.004 | 1,499,893 |
| ssj_ops@100% | 5,925,160 |
| ssj_ops@100% per JVM | 1,481,290 |

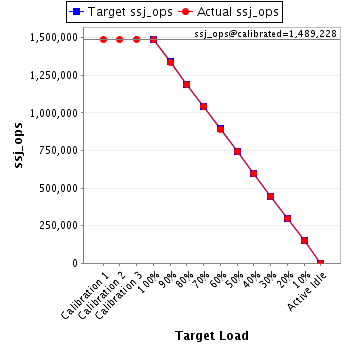
| Target Load | Actual Load | ssj_ops | |
|---|---|---|---|
| Target | Actual | ||
| Calibration 1 | 1,488,567 | ||
| Calibration 2 | 1,488,089 | ||
| Calibration 3 | 1,490,367 | ||
| ssj_ops@calibrated=1,489,228 | |||
| 100% | 99.7% | 1,489,228 | 1,484,900 |
| 90% | 89.9% | 1,340,305 | 1,338,351 |
| 80% | 79.7% | 1,191,382 | 1,187,042 |
| 70% | 70.2% | 1,042,460 | 1,045,111 |
| 60% | 59.9% | 893,537 | 892,349 |
| 50% | 50.0% | 744,614 | 744,944 |
| 40% | 39.9% | 595,691 | 594,148 |
| 30% | 30.0% | 446,768 | 447,196 |
| 20% | 20.1% | 297,846 | 298,925 |
| 10% | 10.0% | 148,923 | 148,521 |
| Active Idle | 0 | 0 | |
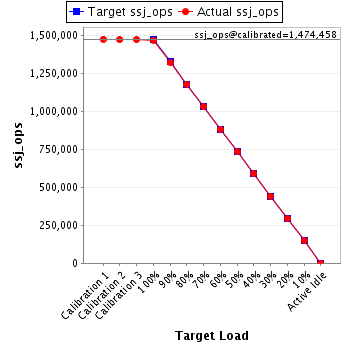
| Target Load | Actual Load | ssj_ops | |
|---|---|---|---|
| Target | Actual | ||
| Calibration 1 | 1,476,607 | ||
| Calibration 2 | 1,473,351 | ||
| Calibration 3 | 1,475,565 | ||
| ssj_ops@calibrated=1,474,458 | |||
| 100% | 99.7% | 1,474,458 | 1,469,608 |
| 90% | 89.7% | 1,327,012 | 1,322,059 |
| 80% | 79.9% | 1,179,566 | 1,178,365 |
| 70% | 70.0% | 1,032,121 | 1,031,894 |
| 60% | 60.0% | 884,675 | 883,967 |
| 50% | 49.8% | 737,229 | 734,871 |
| 40% | 40.0% | 589,783 | 589,706 |
| 30% | 29.9% | 442,337 | 441,153 |
| 20% | 19.9% | 294,892 | 294,090 |
| 10% | 10.0% | 147,446 | 147,182 |
| Active Idle | 0 | 0 | |
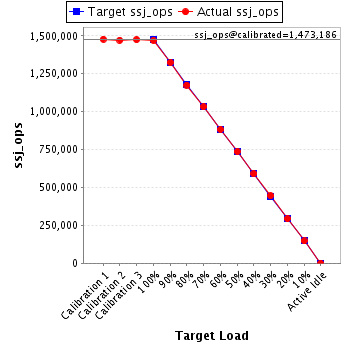
| Target Load | Actual Load | ssj_ops | |
|---|---|---|---|
| Target | Actual | ||
| Calibration 1 | 1,478,370 | ||
| Calibration 2 | 1,471,885 | ||
| Calibration 3 | 1,474,487 | ||
| ssj_ops@calibrated=1,473,186 | |||
| 100% | 99.8% | 1,473,186 | 1,470,759 |
| 90% | 90.0% | 1,325,868 | 1,325,469 |
| 80% | 79.8% | 1,178,549 | 1,175,639 |
| 70% | 70.0% | 1,031,230 | 1,031,655 |
| 60% | 59.9% | 883,912 | 883,146 |
| 50% | 50.0% | 736,593 | 736,620 |
| 40% | 40.0% | 589,274 | 589,894 |
| 30% | 30.2% | 441,956 | 444,659 |
| 20% | 19.9% | 294,637 | 293,087 |
| 10% | 10.0% | 147,319 | 147,003 |
| Active Idle | 0 | 0 | |
| Target Load | Actual Load | ssj_ops | |
|---|---|---|---|
| Target | Actual | ||
| Calibration 1 | 1,505,466 | ||
| Calibration 2 | 1,501,428 | ||
| Calibration 3 | 1,501,325 | ||
| ssj_ops@calibrated=1,501,376 | |||
| 100% | 99.9% | 1,501,376 | 1,499,893 |
| 90% | 90.1% | 1,351,239 | 1,352,851 |
| 80% | 80.0% | 1,201,101 | 1,200,934 |
| 70% | 70.2% | 1,050,963 | 1,053,952 |
| 60% | 60.1% | 900,826 | 901,828 |
| 50% | 50.1% | 750,688 | 751,579 |
| 40% | 40.1% | 600,551 | 602,128 |
| 30% | 30.0% | 450,413 | 450,220 |
| 20% | 20.0% | 300,275 | 299,588 |
| 10% | 10.0% | 150,138 | 150,023 |
| Active Idle | 0 | 0 | |
