SPECpower_ssj2008
Host 'SY480-07' Performance Report
Copyright © 2007-2019 Standard Performance Evaluation Corporation
| Hewlett Packard Enterprise Synergy 480 Gen10 Compute Module | ssj_ops@100% = 5,899,440 ssj_ops@100% per JVM = 1,474,860 |
||||
| Test Sponsor: | Hewlett Packard Enterprise | SPEC License #: | 3 | Test Method: | Multi Node |
| Tested By: | Hewlett Packard Enterprise | Test Location: | Houston, TX, USA | Test Date: | Mar 12, 2019 |
| Hardware Availability: | Apr-2019 | Software Availability: | Mar-2019 | Publication: | Apr 2, 2019 |
| System Source: | Single Supplier | System Designation: | Server | Power Provisioning: | Line-powered |
| Target Load | Actual Load | ssj_ops | |
|---|---|---|---|
| Target | Actual | ||
| Calibration 1 | 5,921,365 | ||
| Calibration 2 | 5,917,032 | ||
| Calibration 3 | 5,915,755 | ||
| ssj_ops@calibrated=5,916,393 | |||
| 100% | 99.7% | 5,916,393 | 5,899,440 |
| 90% | 90.0% | 5,324,754 | 5,325,204 |
| 80% | 80.1% | 4,733,115 | 4,739,166 |
| 70% | 70.0% | 4,141,475 | 4,139,025 |
| 60% | 60.2% | 3,549,836 | 3,559,669 |
| 50% | 50.0% | 2,958,197 | 2,958,006 |
| 40% | 40.1% | 2,366,557 | 2,371,031 |
| 30% | 30.0% | 1,774,918 | 1,774,409 |
| 20% | 20.0% | 1,183,279 | 1,186,069 |
| 10% | 10.0% | 591,639 | 591,217 |
| Active Idle | 0 | 0 | |

| Set Identifier: | SUT |
| Set Description: | System Under Test |
| # of Identical Nodes: | 10 |
| Comment: | SUT |
| Hardware | |
|---|---|
| Hardware Vendor: | Hewlett Packard Enterprise |
| Model: | Synergy 480 Gen10 Compute Module |
| Form Factor: | blade |
| CPU Name: | Intel Xeon Platinum 8280 @ 2.70GHz |
| CPU Characteristics: | 28-Core, 2.70 GHz, 38.5MB L3 Cache |
| CPU Frequency (MHz): | 2700 |
| CPU(s) Enabled: | 56 cores, 2 chips, 28 cores/chip |
| Hardware Threads: | 112 (2 / core) |
| CPU(s) Orderable: | 1,2 chips |
| Primary Cache: | 32 KB I + 32 KB D on chip per core |
| Secondary Cache: | 1 MB I+D on chip per core |
| Tertiary Cache: | 39424 KB I+D on chip per chip |
| Other Cache: | None |
| Memory Amount (GB): | 192 |
| # and size of DIMM: | 12 x 16384 MB |
| Memory Details: | 12 x 16GB 2Rx8 PC4-2933Y-R; slots 1, 3, 5, 8, 10 and 12 populated on each socket |
| Power Supply Quantity and Rating (W): | None |
| Power Supply Details: | N/A |
| Disk Drive: | 1 x HPE 480GB SATA 6G M.2 2280 (875498-B21) |
| Disk Controller: | HPE Smart Array S100i SR Gen10 |
| # and type of Network Interface Cards (NICs) Installed: | 1 x HPE Synergy 3820C 10/20Gb CNA |
| NICs Enabled in Firmware / OS / Connected: | 2/2/1 |
| Network Speed (Mbit): | 1000 |
| Keyboard: | None |
| Mouse: | None |
| Monitor: | None |
| Optical Drives: | No |
| Other Hardware: | None |
| Software | |
|---|---|
| Power Management: | Enabled (see SUT Notes) |
| Operating System (OS): | SUSE Linux Enterprise Server 12 SP4 |
| OS Version: | 4.12.14-94.41-default |
| Filesystem: | xfs |
| JVM Vendor: | Oracle Corporation |
| JVM Version: | Oracle Java HotSpot(TM) 64-Bit Server VM (build 24.80-b11, mixed mode), version 1.7.0_80 |
| JVM Command-line Options: | -server -Xmn19g -Xms21g -Xmx21g -XX:SurvivorRatio=1 -XX:TargetSurvivorRatio=99 -XX:AllocatePrefetchDistance=384 -XX:AllocatePrefetchLines=4 -XX:LoopUnrollLimit=37 -XX:InitialTenuringThreshold=12 -XX:MaxTenuringThreshold=15 -XX:ParallelGCThreads=28 -XX:InlineSmallCode=3900 -XX:MaxInlineSize=270 -XX:FreqInlineSize=2500 -XX:+AggressiveOpts -XX:+UseLargePages -XX:+UseParallelOldGC |
| JVM Affinity: | numactl --cpunodebind=[0-3] --localalloc |
| JVM Instances: | 4 |
| JVM Initial Heap (MB): | 21000 |
| JVM Maximum Heap (MB): | 21000 |
| JVM Address Bits: | 64 |
| Boot Firmware Version: | I42 v2.00 (02/02/2019) |
| Management Firmware Version: | 1.40 Feb 05 2019 |
| Workload Version: | SSJ 1.2.10 |
| Director Location: | Controller |
| Other Software: | HPE Service Pack for ProLiant (SPP) - Version 2019.03.0 (Mar 2019) |
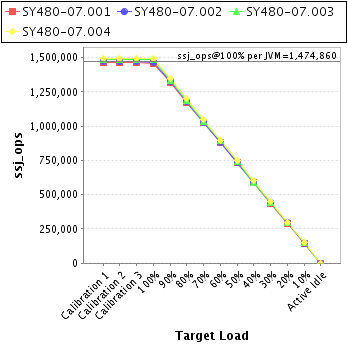
| JVM Instance | ssj_ops@100% |
|---|---|
| SY480-07.001 | 1,458,947 |
| SY480-07.002 | 1,465,655 |
| SY480-07.003 | 1,483,765 |
| SY480-07.004 | 1,491,072 |
| ssj_ops@100% | 5,899,440 |
| ssj_ops@100% per JVM | 1,474,860 |
| Target Load | Actual Load | ssj_ops | |
|---|---|---|---|
| Target | Actual | ||
| Calibration 1 | 1,464,927 | ||
| Calibration 2 | 1,462,122 | ||
| Calibration 3 | 1,464,854 | ||
| ssj_ops@calibrated=1,463,488 | |||
| 100% | 99.7% | 1,463,488 | 1,458,947 |
| 90% | 90.0% | 1,317,139 | 1,317,858 |
| 80% | 80.1% | 1,170,790 | 1,172,949 |
| 70% | 70.0% | 1,024,441 | 1,023,784 |
| 60% | 60.4% | 878,093 | 883,681 |
| 50% | 50.1% | 731,744 | 733,430 |
| 40% | 40.1% | 585,395 | 586,558 |
| 30% | 30.0% | 439,046 | 438,591 |
| 20% | 20.0% | 292,698 | 293,288 |
| 10% | 10.0% | 146,349 | 146,149 |
| Active Idle | 0 | 0 | |

| Target Load | Actual Load | ssj_ops | |
|---|---|---|---|
| Target | Actual | ||
| Calibration 1 | 1,475,563 | ||
| Calibration 2 | 1,470,797 | ||
| Calibration 3 | 1,471,216 | ||
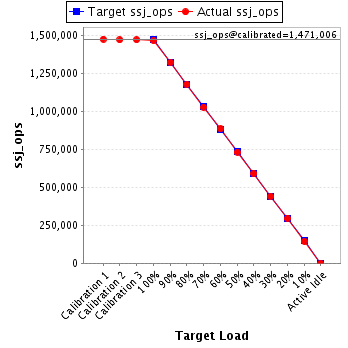
| ssj_ops@calibrated=1,471,006 | |||
| 100% | 99.6% | 1,471,006 | 1,465,655 |
| 90% | 89.9% | 1,323,906 | 1,323,003 |
| 80% | 80.2% | 1,176,805 | 1,179,064 |
| 70% | 69.9% | 1,029,704 | 1,028,614 |
| 60% | 60.1% | 882,604 | 884,361 |
| 50% | 49.7% | 735,503 | 731,517 |
| 40% | 40.1% | 588,402 | 589,738 |
| 30% | 30.0% | 441,302 | 441,981 |
| 20% | 20.1% | 294,201 | 295,393 |
| 10% | 9.8% | 147,101 | 144,719 |
| Active Idle | 0 | 0 | |
| Target Load | Actual Load | ssj_ops | |
|---|---|---|---|
| Target | Actual | ||
| Calibration 1 | 1,487,900 | ||
| Calibration 2 | 1,487,826 | ||
| Calibration 3 | 1,483,690 | ||
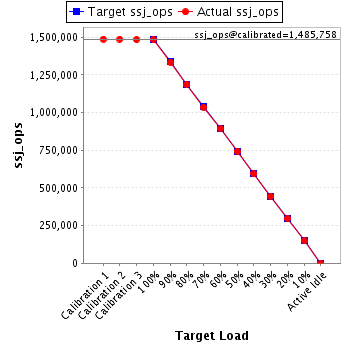
| ssj_ops@calibrated=1,485,758 | |||
| 100% | 99.9% | 1,485,758 | 1,483,765 |
| 90% | 89.9% | 1,337,182 | 1,336,053 |
| 80% | 79.9% | 1,188,606 | 1,187,755 |
| 70% | 69.8% | 1,040,030 | 1,036,334 |
| 60% | 60.1% | 891,455 | 892,376 |
| 50% | 50.0% | 742,879 | 743,006 |
| 40% | 39.9% | 594,303 | 592,816 |
| 30% | 29.9% | 445,727 | 444,399 |
| 20% | 20.1% | 297,152 | 298,766 |
| 10% | 10.1% | 148,576 | 149,385 |
| Active Idle | 0 | 0 | |
| Target Load | Actual Load | ssj_ops | |
|---|---|---|---|
| Target | Actual | ||
| Calibration 1 | 1,492,975 | ||
| Calibration 2 | 1,496,287 | ||
| Calibration 3 | 1,495,996 | ||
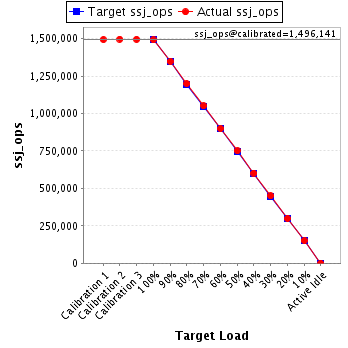
| ssj_ops@calibrated=1,496,141 | |||
| 100% | 99.7% | 1,496,141 | 1,491,072 |
| 90% | 90.1% | 1,346,527 | 1,348,289 |
| 80% | 80.2% | 1,196,913 | 1,199,398 |
| 70% | 70.2% | 1,047,299 | 1,050,294 |
| 60% | 60.1% | 897,685 | 899,250 |
| 50% | 50.1% | 748,071 | 750,053 |
| 40% | 40.2% | 598,457 | 601,920 |
| 30% | 30.0% | 448,842 | 449,438 |
| 20% | 20.0% | 299,228 | 298,621 |
| 10% | 10.1% | 149,614 | 150,964 |
| Active Idle | 0 | 0 | |