
SPECpower_ssj2008
Host 'SY480-03' Performance Report
Copyright © 2007-2019 Standard Performance Evaluation Corporation
| Hewlett Packard Enterprise Synergy 480 Gen10 Compute Module | ssj_ops@100% = 5,920,959 ssj_ops@100% per JVM = 1,480,240 |
||||
| Test Sponsor: | Hewlett Packard Enterprise | SPEC License #: | 3 | Test Method: | Multi Node |
| Tested By: | Hewlett Packard Enterprise | Test Location: | Houston, TX, USA | Test Date: | Mar 12, 2019 |
| Hardware Availability: | Apr-2019 | Software Availability: | Mar-2019 | Publication: | Apr 2, 2019 |
| System Source: | Single Supplier | System Designation: | Server | Power Provisioning: | Line-powered |
| Target Load | Actual Load | ssj_ops | |
|---|---|---|---|
| Target | Actual | ||
| Calibration 1 | 5,956,290 | ||
| Calibration 2 | 5,945,490 | ||
| Calibration 3 | 5,947,721 | ||
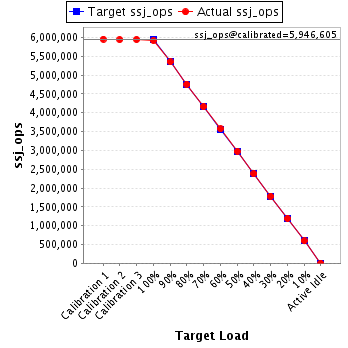
| ssj_ops@calibrated=5,946,605 | |||
| 100% | 99.6% | 5,946,605 | 5,920,959 |
| 90% | 90.0% | 5,351,945 | 5,351,891 |
| 80% | 80.0% | 4,757,284 | 4,757,735 |
| 70% | 70.0% | 4,162,624 | 4,162,705 |
| 60% | 60.1% | 3,567,963 | 3,571,510 |
| 50% | 50.1% | 2,973,303 | 2,977,006 |
| 40% | 40.0% | 2,378,642 | 2,377,011 |
| 30% | 30.0% | 1,783,982 | 1,786,090 |
| 20% | 20.0% | 1,189,321 | 1,188,122 |
| 10% | 10.0% | 594,661 | 593,937 |
| Active Idle | 0 | 0 | |
| Set Identifier: | SUT |
| Set Description: | System Under Test |
| # of Identical Nodes: | 6 |
| Comment: | SUT |
| Hardware | |
|---|---|
| Hardware Vendor: | Hewlett Packard Enterprise |
| Model: | Synergy 480 Gen10 Compute Module |
| Form Factor: | blade |
| CPU Name: | Intel Xeon Platinum 8280 @ 2.70GHz |
| CPU Characteristics: | 28-Core, 2.70 GHz, 38.5MB L3 Cache |
| CPU Frequency (MHz): | 2700 |
| CPU(s) Enabled: | 56 cores, 2 chips, 28 cores/chip |
| Hardware Threads: | 112 (2 / core) |
| CPU(s) Orderable: | 1,2 chips |
| Primary Cache: | 32 KB I + 32 KB D on chip per core |
| Secondary Cache: | 1 MB I+D on chip per core |
| Tertiary Cache: | 39424 KB I+D on chip per chip |
| Other Cache: | None |
| Memory Amount (GB): | 192 |
| # and size of DIMM: | 12 x 16384 MB |
| Memory Details: | 12 x 16GB 2Rx8 PC4-2933Y-R; slots 1, 3, 5, 8, 10 and 12 populated on each socket |
| Power Supply Quantity and Rating (W): | None |
| Power Supply Details: | N/A |
| Disk Drive: | 1 x HPE 480GB SATA 6G M.2 2280 (875498-B21) |
| Disk Controller: | HPE Smart Array S100i SR Gen10 |
| # and type of Network Interface Cards (NICs) Installed: | 1 x HPE Synergy 3820C 10/20Gb CNA |
| NICs Enabled in Firmware / OS / Connected: | 2/2/1 |
| Network Speed (Mbit): | 1000 |
| Keyboard: | None |
| Mouse: | None |
| Monitor: | None |
| Optical Drives: | No |
| Other Hardware: | None |
| Software | |
|---|---|
| Power Management: | Enabled (see SUT Notes) |
| Operating System (OS): | SUSE Linux Enterprise Server 12 SP4 |
| OS Version: | 4.12.14-94.41-default |
| Filesystem: | xfs |
| JVM Vendor: | Oracle Corporation |
| JVM Version: | Oracle Java HotSpot(TM) 64-Bit Server VM (build 24.80-b11, mixed mode), version 1.7.0_80 |
| JVM Command-line Options: | -server -Xmn19g -Xms21g -Xmx21g -XX:SurvivorRatio=1 -XX:TargetSurvivorRatio=99 -XX:AllocatePrefetchDistance=384 -XX:AllocatePrefetchLines=4 -XX:LoopUnrollLimit=37 -XX:InitialTenuringThreshold=12 -XX:MaxTenuringThreshold=15 -XX:ParallelGCThreads=28 -XX:InlineSmallCode=3900 -XX:MaxInlineSize=270 -XX:FreqInlineSize=2500 -XX:+AggressiveOpts -XX:+UseLargePages -XX:+UseParallelOldGC |
| JVM Affinity: | numactl --cpunodebind=[0-3] --localalloc |
| JVM Instances: | 4 |
| JVM Initial Heap (MB): | 21000 |
| JVM Maximum Heap (MB): | 21000 |
| JVM Address Bits: | 64 |
| Boot Firmware Version: | I42 v2.00 (02/02/2019) |
| Management Firmware Version: | 1.40 Feb 05 2019 |
| Workload Version: | SSJ 1.2.10 |
| Director Location: | Controller |
| Other Software: | HPE Service Pack for ProLiant (SPP) - Version 2019.03.0 (Mar 2019) |
| JVM Instance | ssj_ops@100% |
|---|---|
| SY480-03.001 | 1,476,512 |
| SY480-03.002 | 1,489,358 |
| SY480-03.003 | 1,481,186 |
| SY480-03.004 | 1,473,904 |
| ssj_ops@100% | 5,920,959 |
| ssj_ops@100% per JVM | 1,480,240 |

| Target Load | Actual Load | ssj_ops | |
|---|---|---|---|
| Target | Actual | ||
| Calibration 1 | 1,484,758 | ||
| Calibration 2 | 1,480,540 | ||
| Calibration 3 | 1,487,285 | ||
| ssj_ops@calibrated=1,483,913 | |||
| 100% | 99.5% | 1,483,913 | 1,476,512 |
| 90% | 89.9% | 1,335,521 | 1,333,595 |
| 80% | 79.7% | 1,187,130 | 1,183,217 |
| 70% | 70.1% | 1,038,739 | 1,040,533 |
| 60% | 60.0% | 890,348 | 890,682 |
| 50% | 50.1% | 741,956 | 742,761 |
| 40% | 40.1% | 593,565 | 594,334 |
| 30% | 30.0% | 445,174 | 445,594 |
| 20% | 19.9% | 296,783 | 295,496 |
| 10% | 10.0% | 148,391 | 148,828 |
| Active Idle | 0 | 0 | |

| Target Load | Actual Load | ssj_ops | |
|---|---|---|---|
| Target | Actual | ||
| Calibration 1 | 1,497,464 | ||
| Calibration 2 | 1,495,499 | ||
| Calibration 3 | 1,494,773 | ||
| ssj_ops@calibrated=1,495,136 | |||
| 100% | 99.6% | 1,495,136 | 1,489,358 |
| 90% | 89.8% | 1,345,623 | 1,342,114 |
| 80% | 80.2% | 1,196,109 | 1,198,776 |
| 70% | 70.2% | 1,046,595 | 1,049,896 |
| 60% | 60.0% | 897,082 | 897,668 |
| 50% | 50.0% | 747,568 | 747,680 |
| 40% | 40.0% | 598,055 | 598,781 |
| 30% | 30.0% | 448,541 | 448,330 |
| 20% | 19.8% | 299,027 | 295,964 |
| 10% | 10.0% | 149,514 | 149,637 |
| Active Idle | 0 | 0 | |

| Target Load | Actual Load | ssj_ops | |
|---|---|---|---|
| Target | Actual | ||
| Calibration 1 | 1,487,313 | ||
| Calibration 2 | 1,485,833 | ||
| Calibration 3 | 1,486,772 | ||
| ssj_ops@calibrated=1,486,303 | |||
| 100% | 99.7% | 1,486,303 | 1,481,186 |
| 90% | 90.1% | 1,337,673 | 1,339,264 |
| 80% | 79.9% | 1,189,042 | 1,188,136 |
| 70% | 69.9% | 1,040,412 | 1,039,175 |
| 60% | 60.0% | 891,782 | 892,377 |
| 50% | 50.0% | 743,151 | 743,207 |
| 40% | 39.8% | 594,521 | 592,114 |
| 30% | 30.0% | 445,891 | 445,955 |
| 20% | 20.1% | 297,261 | 298,676 |
| 10% | 10.0% | 148,630 | 148,562 |
| Active Idle | 0 | 0 | |

| Target Load | Actual Load | ssj_ops | |
|---|---|---|---|
| Target | Actual | ||
| Calibration 1 | 1,486,755 | ||
| Calibration 2 | 1,483,617 | ||
| Calibration 3 | 1,478,890 | ||
| ssj_ops@calibrated=1,481,254 | |||
| 100% | 99.5% | 1,481,254 | 1,473,904 |
| 90% | 90.3% | 1,333,128 | 1,336,918 |
| 80% | 80.2% | 1,185,003 | 1,187,606 |
| 70% | 69.7% | 1,036,878 | 1,033,100 |
| 60% | 60.1% | 888,752 | 890,784 |
| 50% | 50.2% | 740,627 | 743,359 |
| 40% | 40.0% | 592,501 | 591,781 |
| 30% | 30.1% | 444,376 | 446,211 |
| 20% | 20.1% | 296,251 | 297,986 |
| 10% | 9.9% | 148,125 | 146,910 |
| Active Idle | 0 | 0 | |
