SPECpower_ssj2008
Host 'SY480-01' Performance Report
Copyright © 2007-2019 Standard Performance Evaluation Corporation
| Hewlett Packard Enterprise Synergy 480 Gen10 Compute Module | ssj_ops@100% = 5,943,642 ssj_ops@100% per JVM = 1,485,910 |
||||
| Test Sponsor: | Hewlett Packard Enterprise | SPEC License #: | 3 | Test Method: | Multi Node |
| Tested By: | Hewlett Packard Enterprise | Test Location: | Houston, TX, USA | Test Date: | Mar 12, 2019 |
| Hardware Availability: | Apr-2019 | Software Availability: | Mar-2019 | Publication: | Apr 2, 2019 |
| System Source: | Single Supplier | System Designation: | Server | Power Provisioning: | Line-powered |
| Target Load | Actual Load | ssj_ops | |
|---|---|---|---|
| Target | Actual | ||
| Calibration 1 | 5,977,944 | ||
| Calibration 2 | 5,955,457 | ||
| Calibration 3 | 5,967,794 | ||
| ssj_ops@calibrated=5,961,625 | |||
| 100% | 99.7% | 5,961,625 | 5,943,642 |
| 90% | 90.0% | 5,365,463 | 5,365,379 |
| 80% | 80.1% | 4,769,300 | 4,772,345 |
| 70% | 70.0% | 4,173,138 | 4,171,810 |
| 60% | 60.1% | 3,576,975 | 3,584,017 |
| 50% | 50.1% | 2,980,813 | 2,984,598 |
| 40% | 40.0% | 2,384,650 | 2,386,477 |
| 30% | 30.1% | 1,788,488 | 1,793,576 |
| 20% | 20.0% | 1,192,325 | 1,190,798 |
| 10% | 10.0% | 596,163 | 594,973 |
| Active Idle | 0 | 0 | |

| Set Identifier: | SUT |
| Set Description: | System Under Test |
| # of Identical Nodes: | 5 |
| Comment: | SUT |
| Hardware | |
|---|---|
| Hardware Vendor: | Hewlett Packard Enterprise |
| Model: | Synergy 480 Gen10 Compute Module |
| Form Factor: | blade |
| CPU Name: | Intel Xeon Platinum 8280 @ 2.70GHz |
| CPU Characteristics: | 28-Core, 2.70 GHz, 38.5MB L3 Cache |
| CPU Frequency (MHz): | 2700 |
| CPU(s) Enabled: | 56 cores, 2 chips, 28 cores/chip |
| Hardware Threads: | 112 (2 / core) |
| CPU(s) Orderable: | 1,2 chips |
| Primary Cache: | 32 KB I + 32 KB D on chip per core |
| Secondary Cache: | 1 MB I+D on chip per core |
| Tertiary Cache: | 39424 KB I+D on chip per chip |
| Other Cache: | None |
| Memory Amount (GB): | 192 |
| # and size of DIMM: | 12 x 16384 MB |
| Memory Details: | 12 x 16GB 2Rx8 PC4-2933Y-R; slots 1, 3, 5, 8, 10 and 12 populated on each socket |
| Power Supply Quantity and Rating (W): | None |
| Power Supply Details: | N/A |
| Disk Drive: | 1 x HPE 480GB SATA 6G M.2 2280 (875498-B21) |
| Disk Controller: | HPE Smart Array S100i SR Gen10 |
| # and type of Network Interface Cards (NICs) Installed: | 1 x HPE Synergy 3820C 10/20Gb CNA |
| NICs Enabled in Firmware / OS / Connected: | 2/2/1 |
| Network Speed (Mbit): | 1000 |
| Keyboard: | None |
| Mouse: | None |
| Monitor: | None |
| Optical Drives: | No |
| Other Hardware: | None |
| Software | |
|---|---|
| Power Management: | Enabled (see SUT Notes) |
| Operating System (OS): | SUSE Linux Enterprise Server 12 SP4 |
| OS Version: | 4.12.14-94.41-default |
| Filesystem: | xfs |
| JVM Vendor: | Oracle Corporation |
| JVM Version: | Oracle Java HotSpot(TM) 64-Bit Server VM (build 24.80-b11, mixed mode), version 1.7.0_80 |
| JVM Command-line Options: | -server -Xmn19g -Xms21g -Xmx21g -XX:SurvivorRatio=1 -XX:TargetSurvivorRatio=99 -XX:AllocatePrefetchDistance=384 -XX:AllocatePrefetchLines=4 -XX:LoopUnrollLimit=37 -XX:InitialTenuringThreshold=12 -XX:MaxTenuringThreshold=15 -XX:ParallelGCThreads=28 -XX:InlineSmallCode=3900 -XX:MaxInlineSize=270 -XX:FreqInlineSize=2500 -XX:+AggressiveOpts -XX:+UseLargePages -XX:+UseParallelOldGC |
| JVM Affinity: | numactl --cpunodebind=[0-3] --localalloc |
| JVM Instances: | 4 |
| JVM Initial Heap (MB): | 21000 |
| JVM Maximum Heap (MB): | 21000 |
| JVM Address Bits: | 64 |
| Boot Firmware Version: | I42 v2.00 (02/02/2019) |
| Management Firmware Version: | 1.40 Feb 05 2019 |
| Workload Version: | SSJ 1.2.10 |
| Director Location: | Controller |
| Other Software: | HPE Service Pack for ProLiant (SPP) - Version 2019.03.0 (Mar 2019) |
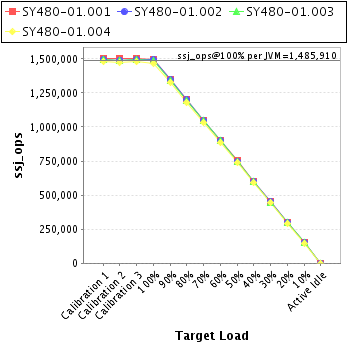
| JVM Instance | ssj_ops@100% |
|---|---|
| SY480-01.001 | 1,492,768 |
| SY480-01.002 | 1,492,734 |
| SY480-01.003 | 1,489,127 |
| SY480-01.004 | 1,469,013 |
| ssj_ops@100% | 5,943,642 |
| ssj_ops@100% per JVM | 1,485,910 |
| Target Load | Actual Load | ssj_ops | |
|---|---|---|---|
| Target | Actual | ||
| Calibration 1 | 1,504,718 | ||
| Calibration 2 | 1,499,149 | ||
| Calibration 3 | 1,502,415 | ||
| ssj_ops@calibrated=1,500,782 | |||
| 100% | 99.5% | 1,500,782 | 1,492,768 |
| 90% | 89.8% | 1,350,704 | 1,348,345 |
| 80% | 80.1% | 1,200,626 | 1,202,279 |
| 70% | 70.0% | 1,050,547 | 1,050,692 |
| 60% | 59.9% | 900,469 | 899,393 |
| 50% | 50.2% | 750,391 | 753,498 |
| 40% | 40.1% | 600,313 | 601,840 |
| 30% | 30.1% | 450,235 | 451,245 |
| 20% | 20.0% | 300,156 | 299,969 |
| 10% | 9.9% | 150,078 | 148,696 |
| Active Idle | 0 | 0 | |
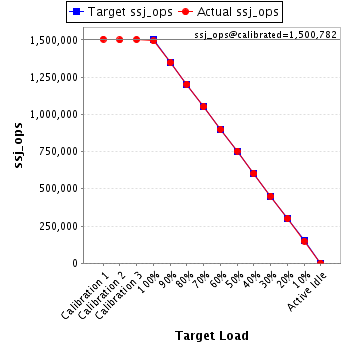
| Target Load | Actual Load | ssj_ops | |
|---|---|---|---|
| Target | Actual | ||
| Calibration 1 | 1,496,518 | ||
| Calibration 2 | 1,491,087 | ||
| Calibration 3 | 1,495,272 | ||
| ssj_ops@calibrated=1,493,179 | |||
| 100% | 100.0% | 1,493,179 | 1,492,734 |
| 90% | 90.1% | 1,343,861 | 1,344,687 |
| 80% | 80.3% | 1,194,544 | 1,198,676 |
| 70% | 70.0% | 1,045,226 | 1,045,895 |
| 60% | 60.1% | 895,908 | 897,868 |
| 50% | 50.0% | 746,590 | 746,676 |
| 40% | 40.0% | 597,272 | 596,814 |
| 30% | 30.1% | 447,954 | 449,574 |
| 20% | 20.0% | 298,636 | 298,694 |
| 10% | 10.0% | 149,318 | 149,308 |
| Active Idle | 0 | 0 | |

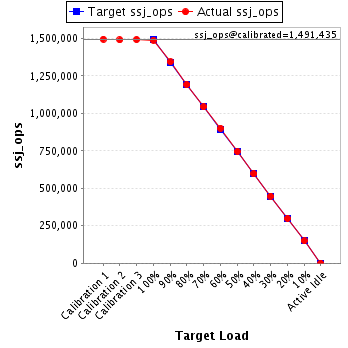
| Target Load | Actual Load | ssj_ops | |
|---|---|---|---|
| Target | Actual | ||
| Calibration 1 | 1,495,725 | ||
| Calibration 2 | 1,490,247 | ||
| Calibration 3 | 1,492,623 | ||
| ssj_ops@calibrated=1,491,435 | |||
| 100% | 99.8% | 1,491,435 | 1,489,127 |
| 90% | 90.1% | 1,342,292 | 1,343,995 |
| 80% | 80.0% | 1,193,148 | 1,192,689 |
| 70% | 70.0% | 1,044,005 | 1,043,829 |
| 60% | 60.5% | 894,861 | 902,123 |
| 50% | 50.0% | 745,718 | 745,955 |
| 40% | 40.0% | 596,574 | 596,881 |
| 30% | 30.1% | 447,431 | 448,647 |
| 20% | 20.0% | 298,287 | 298,548 |
| 10% | 10.0% | 149,144 | 149,350 |
| Active Idle | 0 | 0 | |
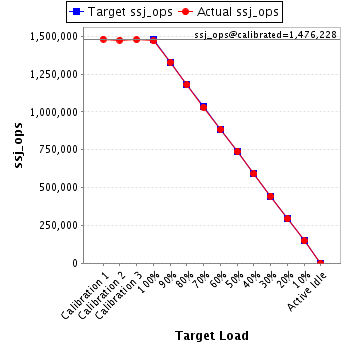
| Target Load | Actual Load | ssj_ops | |
|---|---|---|---|
| Target | Actual | ||
| Calibration 1 | 1,480,983 | ||
| Calibration 2 | 1,474,974 | ||
| Calibration 3 | 1,477,483 | ||
| ssj_ops@calibrated=1,476,228 | |||
| 100% | 99.5% | 1,476,228 | 1,469,013 |
| 90% | 90.0% | 1,328,605 | 1,328,353 |
| 80% | 79.8% | 1,180,983 | 1,178,701 |
| 70% | 69.9% | 1,033,360 | 1,031,393 |
| 60% | 59.9% | 885,737 | 884,633 |
| 50% | 50.0% | 738,114 | 738,470 |
| 40% | 40.0% | 590,491 | 590,942 |
| 30% | 30.1% | 442,868 | 444,110 |
| 20% | 19.9% | 295,246 | 293,587 |
| 10% | 10.0% | 147,623 | 147,619 |
| Active Idle | 0 | 0 | |