
SPECpower_ssj2008
Host 'SY480-02' Performance Report
Copyright © 2007-2019 Standard Performance Evaluation Corporation
| Hewlett Packard Enterprise Synergy 480 Gen10 Compute Module | ssj_ops@100% = 5,916,591 ssj_ops@100% per JVM = 1,479,148 |
||||
| Test Sponsor: | Hewlett Packard Enterprise | SPEC License #: | 3 | Test Method: | Multi Node |
| Tested By: | Hewlett Packard Enterprise | Test Location: | Houston, TX, USA | Test Date: | Mar 12, 2019 |
| Hardware Availability: | Apr-2019 | Software Availability: | Mar-2019 | Publication: | Apr 2, 2019 |
| System Source: | Single Supplier | System Designation: | Server | Power Provisioning: | Line-powered |
| Target Load | Actual Load | ssj_ops | |
|---|---|---|---|
| Target | Actual | ||
| Calibration 1 | 5,953,565 | ||
| Calibration 2 | 5,921,946 | ||
| Calibration 3 | 5,934,315 | ||
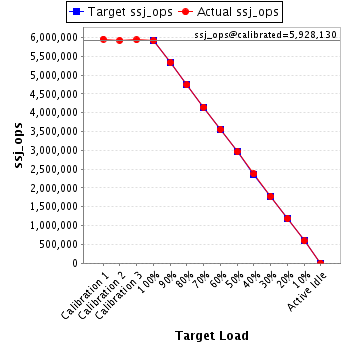
| ssj_ops@calibrated=5,928,130 | |||
| 100% | 99.8% | 5,928,130 | 5,916,591 |
| 90% | 90.0% | 5,335,317 | 5,337,377 |
| 80% | 79.9% | 4,742,504 | 4,738,918 |
| 70% | 70.0% | 4,149,691 | 4,148,084 |
| 60% | 60.0% | 3,556,878 | 3,558,210 |
| 50% | 50.0% | 2,964,065 | 2,962,155 |
| 40% | 40.0% | 2,371,252 | 2,371,945 |
| 30% | 30.0% | 1,778,439 | 1,776,822 |
| 20% | 20.0% | 1,185,626 | 1,187,167 |
| 10% | 10.0% | 592,813 | 594,824 |
| Active Idle | 0 | 0 | |
| Set Identifier: | SUT |
| Set Description: | System Under Test |
| # of Identical Nodes: | 5 |
| Comment: | SUT |
| Hardware | |
|---|---|
| Hardware Vendor: | Hewlett Packard Enterprise |
| Model: | Synergy 480 Gen10 Compute Module |
| Form Factor: | blade |
| CPU Name: | Intel Xeon Platinum 8280 @ 2.70GHz |
| CPU Characteristics: | 28-Core, 2.70 GHz, 38.5MB L3 Cache |
| CPU Frequency (MHz): | 2700 |
| CPU(s) Enabled: | 56 cores, 2 chips, 28 cores/chip |
| Hardware Threads: | 112 (2 / core) |
| CPU(s) Orderable: | 1,2 chips |
| Primary Cache: | 32 KB I + 32 KB D on chip per core |
| Secondary Cache: | 1 MB I+D on chip per core |
| Tertiary Cache: | 39424 KB I+D on chip per chip |
| Other Cache: | None |
| Memory Amount (GB): | 192 |
| # and size of DIMM: | 12 x 16384 MB |
| Memory Details: | 12 x 16GB 2Rx8 PC4-2933Y-R; slots 1, 3, 5, 8, 10 and 12 populated on each socket |
| Power Supply Quantity and Rating (W): | None |
| Power Supply Details: | N/A |
| Disk Drive: | 1 x HPE 480GB SATA 6G M.2 2280 (875498-B21) |
| Disk Controller: | HPE Smart Array S100i SR Gen10 |
| # and type of Network Interface Cards (NICs) Installed: | 1 x HPE Synergy 3820C 10/20Gb CNA |
| NICs Enabled in Firmware / OS / Connected: | 2/2/1 |
| Network Speed (Mbit): | 1000 |
| Keyboard: | None |
| Mouse: | None |
| Monitor: | None |
| Optical Drives: | No |
| Other Hardware: | None |
| Software | |
|---|---|
| Power Management: | Enabled (see SUT Notes) |
| Operating System (OS): | SUSE Linux Enterprise Server 12 SP4 |
| OS Version: | 4.12.14-94.41-default |
| Filesystem: | xfs |
| JVM Vendor: | Oracle Corporation |
| JVM Version: | Oracle Java HotSpot(TM) 64-Bit Server VM (build 24.80-b11, mixed mode), version 1.7.0_80 |
| JVM Command-line Options: | -server -Xmn19g -Xms21g -Xmx21g -XX:SurvivorRatio=1 -XX:TargetSurvivorRatio=99 -XX:AllocatePrefetchDistance=384 -XX:AllocatePrefetchLines=4 -XX:LoopUnrollLimit=37 -XX:InitialTenuringThreshold=12 -XX:MaxTenuringThreshold=15 -XX:ParallelGCThreads=28 -XX:InlineSmallCode=3900 -XX:MaxInlineSize=270 -XX:FreqInlineSize=2500 -XX:+AggressiveOpts -XX:+UseLargePages -XX:+UseParallelOldGC |
| JVM Affinity: | numactl --cpunodebind=[0-3] --localalloc |
| JVM Instances: | 4 |
| JVM Initial Heap (MB): | 21000 |
| JVM Maximum Heap (MB): | 21000 |
| JVM Address Bits: | 64 |
| Boot Firmware Version: | I42 v2.00 (02/02/2019) |
| Management Firmware Version: | 1.40 Feb 05 2019 |
| Workload Version: | SSJ 1.2.10 |
| Director Location: | Controller |
| Other Software: | HPE Service Pack for ProLiant (SPP) - Version 2019.03.0 (Mar 2019) |
| JVM Instance | ssj_ops@100% |
|---|---|
| SY480-02.001 | 1,488,341 |
| SY480-02.002 | 1,481,512 |
| SY480-02.003 | 1,474,554 |
| SY480-02.004 | 1,472,184 |
| ssj_ops@100% | 5,916,591 |
| ssj_ops@100% per JVM | 1,479,148 |

| Target Load | Actual Load | ssj_ops | |
|---|---|---|---|
| Target | Actual | ||
| Calibration 1 | 1,495,321 | ||
| Calibration 2 | 1,490,447 | ||
| Calibration 3 | 1,489,887 | ||
| ssj_ops@calibrated=1,490,167 | |||
| 100% | 99.9% | 1,490,167 | 1,488,341 |
| 90% | 90.1% | 1,341,150 | 1,342,429 |
| 80% | 79.8% | 1,192,134 | 1,188,703 |
| 70% | 70.0% | 1,043,117 | 1,043,289 |
| 60% | 60.0% | 894,100 | 894,063 |
| 50% | 49.9% | 745,084 | 743,046 |
| 40% | 40.0% | 596,067 | 595,897 |
| 30% | 30.0% | 447,050 | 446,357 |
| 20% | 20.0% | 298,033 | 297,659 |
| 10% | 10.1% | 149,017 | 150,474 |
| Active Idle | 0 | 0 | |

| Target Load | Actual Load | ssj_ops | |
|---|---|---|---|
| Target | Actual | ||
| Calibration 1 | 1,488,255 | ||
| Calibration 2 | 1,480,038 | ||
| Calibration 3 | 1,484,582 | ||
| ssj_ops@calibrated=1,482,310 | |||
| 100% | 99.9% | 1,482,310 | 1,481,512 |
| 90% | 89.9% | 1,334,079 | 1,332,406 |
| 80% | 80.2% | 1,185,848 | 1,188,616 |
| 70% | 69.9% | 1,037,617 | 1,035,865 |
| 60% | 60.2% | 889,386 | 892,337 |
| 50% | 49.9% | 741,155 | 740,223 |
| 40% | 40.0% | 592,924 | 592,786 |
| 30% | 30.0% | 444,693 | 445,432 |
| 20% | 19.9% | 296,462 | 295,491 |
| 10% | 10.0% | 148,231 | 147,741 |
| Active Idle | 0 | 0 | |

| Target Load | Actual Load | ssj_ops | |
|---|---|---|---|
| Target | Actual | ||
| Calibration 1 | 1,486,450 | ||
| Calibration 2 | 1,475,194 | ||
| Calibration 3 | 1,479,464 | ||
| ssj_ops@calibrated=1,477,329 | |||
| 100% | 99.8% | 1,477,329 | 1,474,554 |
| 90% | 90.0% | 1,329,596 | 1,329,581 |
| 80% | 80.0% | 1,181,863 | 1,182,312 |
| 70% | 70.1% | 1,034,130 | 1,036,018 |
| 60% | 59.8% | 886,397 | 883,752 |
| 50% | 50.0% | 738,665 | 739,268 |
| 40% | 40.0% | 590,932 | 590,805 |
| 30% | 29.9% | 443,199 | 442,244 |
| 20% | 20.1% | 295,466 | 296,315 |
| 10% | 10.0% | 147,733 | 147,685 |
| Active Idle | 0 | 0 | |

| Target Load | Actual Load | ssj_ops | |
|---|---|---|---|
| Target | Actual | ||
| Calibration 1 | 1,483,540 | ||
| Calibration 2 | 1,476,267 | ||
| Calibration 3 | 1,480,382 | ||
| ssj_ops@calibrated=1,478,324 | |||
| 100% | 99.6% | 1,478,324 | 1,472,184 |
| 90% | 90.2% | 1,330,492 | 1,332,962 |
| 80% | 79.8% | 1,182,659 | 1,179,287 |
| 70% | 69.9% | 1,034,827 | 1,032,912 |
| 60% | 60.1% | 886,994 | 888,058 |
| 50% | 50.0% | 739,162 | 739,618 |
| 40% | 40.1% | 591,330 | 592,456 |
| 30% | 30.0% | 443,497 | 442,789 |
| 20% | 20.1% | 295,665 | 297,702 |
| 10% | 10.1% | 147,832 | 148,924 |
| Active Idle | 0 | 0 | |
