SPECpower_ssj2008
Host 'NODE01' Performance Report
Copyright © 2007-2019 Standard Performance Evaluation Corporation
| Hewlett Packard Enterprise Synergy 480 Gen10 Compute Module | ssj_ops@100% = 5,760,565 ssj_ops@100% per JVM = 1,440,141 |
||||
| Test Sponsor: | Hewlett Packard Enterprise | SPEC License #: | 3 | Test Method: | Multi Node |
| Tested By: | Hewlett Packard Enterprise | Test Location: | Houston, TX, USA | Test Date: | Mar 28, 2019 |
| Hardware Availability: | Apr-2019 | Software Availability: | Mar-2019 | Publication: | May 8, 2019 |
| System Source: | Single Supplier | System Designation: | Server | Power Provisioning: | Line-powered |
| Target Load | Actual Load | ssj_ops | |
|---|---|---|---|
| Target | Actual | ||
| Calibration 1 | 5,784,556 | ||
| Calibration 2 | 5,777,013 | ||
| Calibration 3 | 5,780,917 | ||
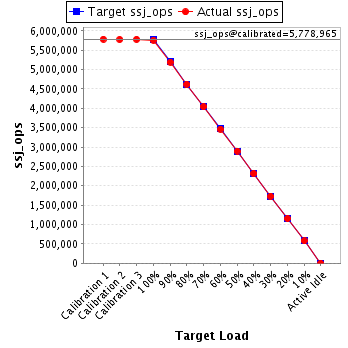
| ssj_ops@calibrated=5,778,965 | |||
| 100% | 99.7% | 5,778,965 | 5,760,565 |
| 90% | 89.9% | 5,201,069 | 5,192,680 |
| 80% | 80.0% | 4,623,172 | 4,620,368 |
| 70% | 69.9% | 4,045,276 | 4,041,090 |
| 60% | 60.0% | 3,467,379 | 3,464,697 |
| 50% | 50.1% | 2,889,483 | 2,896,677 |
| 40% | 40.0% | 2,311,586 | 2,313,067 |
| 30% | 30.0% | 1,733,690 | 1,733,723 |
| 20% | 20.0% | 1,155,793 | 1,153,349 |
| 10% | 10.0% | 577,897 | 577,656 |
| Active Idle | 0 | 0 | |
| Set Identifier: | SUT |
| Set Description: | System Under Test |
| # of Identical Nodes: | 2 |
| Comment: | SUT |
| Hardware | |
|---|---|
| Hardware Vendor: | Hewlett Packard Enterprise |
| Model: | Synergy 480 Gen10 Compute Module |
| Form Factor: | 7U |
| CPU Name: | Intel Xeon Platinum 8280 @ 2.70GHz (Intel Turbo Boost Technology up to 4.00 GHz) |
| CPU Characteristics: | 28-Core, 2.70 GHz, 38.5MB L3 Cache |
| CPU Frequency (MHz): | 2700 |
| CPU(s) Enabled: | 56 cores, 2 chips, 28 cores/chip |
| Hardware Threads: | 112 (2 / core) |
| CPU(s) Orderable: | 1,2 chips |
| Primary Cache: | 32 KB I + 32 KB D on chip per core |
| Secondary Cache: | 1 MB I+D on chip per core |
| Tertiary Cache: | 39424 KB I+D on chip per chip |
| Other Cache: | None |
| Memory Amount (GB): | 192 |
| # and size of DIMM: | 12 x 16384 MB |
| Memory Details: | 12 x 16GB 2Rx8 PC4-2933Y-R; slots 1, 3, 5, 8, 10 and 12 populated in each socket |
| Power Supply Quantity and Rating (W): | None |
| Power Supply Details: | N/A |
| Disk Drive: | 1 x HPE 240GB 6G SATA M.2 SSD (875488-B21) |
| Disk Controller: | HPE Smart Array S100i SR Gen10 |
| # and type of Network Interface Cards (NICs) Installed: | 1 x HPE Synergy 3820C 10/20Gb CNA |
| NICs Enabled in Firmware / OS / Connected: | 2/2/1 |
| Network Speed (Mbit): | 1000 |
| Keyboard: | None |
| Mouse: | None |
| Monitor: | None |
| Optical Drives: | No |
| Other Hardware: | H/S: Standard |
| Software | |
|---|---|
| Power Management: | Enabled (see SUT Notes) |
| Operating System (OS): | Windows Server 2012 R2 Datacenter |
| OS Version: | Version 6.3 (Build 9600) |
| Filesystem: | NTFS |
| JVM Vendor: | Oracle Corporation |
| JVM Version: | Oracle Java HotSpot(TM) 64-Bit Server VM (build 24.80-b11, mixed mode), version 1.7.0_80 |
| JVM Command-line Options: | -server -Xmn21000m -Xms24000m -Xmx24000m -XX:SurvivorRatio=1 -XX:TargetSurvivorRatio=99 -XX:AllocatePrefetchDistance=256 -XX:AllocatePrefetchLines=4 -XX:LoopUnrollLimit=45 -XX:InitialTenuringThreshold=12 -XX:MaxTenuringThreshold=15 -XX:ParallelGCThreads=28 -XX:InlineSmallCode=3900 -XX:MaxInlineSize=270 -XX:FreqInlineSize=2500 -XX:+AggressiveOpts -XX:+UseLargePages -XX:+UseParallelOldGC |
| JVM Affinity: | start /NODE [0,1,2,3] /AFFINITY [0xFFFFFFF] |
| JVM Instances: | 4 |
| JVM Initial Heap (MB): | 24000 |
| JVM Maximum Heap (MB): | 24000 |
| JVM Address Bits: | 64 |
| Boot Firmware Version: | I42 v2.00 (02/02/2019) |
| Management Firmware Version: | 1.40 Feb 05 2019 |
| Workload Version: | SSJ 1.2.10 |
| Director Location: | Controller |
| Other Software: | HPE Service Pack for ProLiant (SPP) Version: 2019.03.0, Microsoft Windows KB4056898, KB4338815 |
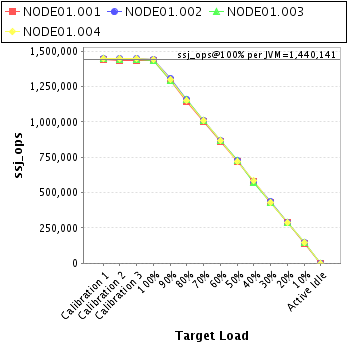
| JVM Instance | ssj_ops@100% |
|---|---|
| NODE01.001 | 1,434,106 |
| NODE01.002 | 1,445,073 |
| NODE01.003 | 1,437,454 |
| NODE01.004 | 1,443,932 |
| ssj_ops@100% | 5,760,565 |
| ssj_ops@100% per JVM | 1,440,141 |
| Target Load | Actual Load | ssj_ops | |
|---|---|---|---|
| Target | Actual | ||
| Calibration 1 | 1,440,682 | ||
| Calibration 2 | 1,436,222 | ||
| Calibration 3 | 1,437,583 | ||
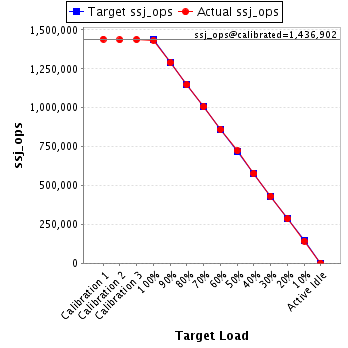
| ssj_ops@calibrated=1,436,902 | |||
| 100% | 99.8% | 1,436,902 | 1,434,106 |
| 90% | 89.8% | 1,293,212 | 1,290,914 |
| 80% | 79.9% | 1,149,522 | 1,147,525 |
| 70% | 70.0% | 1,005,832 | 1,005,867 |
| 60% | 59.8% | 862,141 | 859,352 |
| 50% | 50.3% | 718,451 | 722,287 |
| 40% | 40.1% | 574,761 | 576,111 |
| 30% | 30.1% | 431,071 | 432,283 |
| 20% | 19.8% | 287,380 | 285,069 |
| 10% | 9.9% | 143,690 | 142,212 |
| Active Idle | 0 | 0 | |
| Target Load | Actual Load | ssj_ops | |
|---|---|---|---|
| Target | Actual | ||
| Calibration 1 | 1,450,532 | ||
| Calibration 2 | 1,449,440 | ||
| Calibration 3 | 1,451,471 | ||
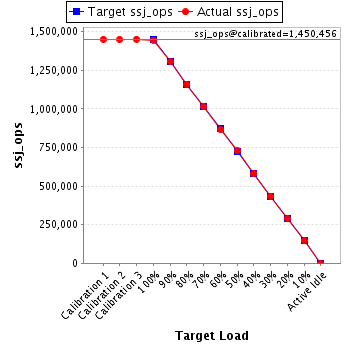
| ssj_ops@calibrated=1,450,456 | |||
| 100% | 99.6% | 1,450,456 | 1,445,073 |
| 90% | 90.0% | 1,305,410 | 1,306,084 |
| 80% | 80.0% | 1,160,364 | 1,160,951 |
| 70% | 69.9% | 1,015,319 | 1,013,257 |
| 60% | 59.8% | 870,273 | 867,416 |
| 50% | 50.1% | 725,228 | 727,399 |
| 40% | 39.9% | 580,182 | 579,305 |
| 30% | 30.0% | 435,137 | 435,466 |
| 20% | 20.0% | 290,091 | 290,215 |
| 10% | 10.0% | 145,046 | 144,821 |
| Active Idle | 0 | 0 | |
| Target Load | Actual Load | ssj_ops | |
|---|---|---|---|
| Target | Actual | ||
| Calibration 1 | 1,446,023 | ||
| Calibration 2 | 1,444,456 | ||
| Calibration 3 | 1,444,270 | ||
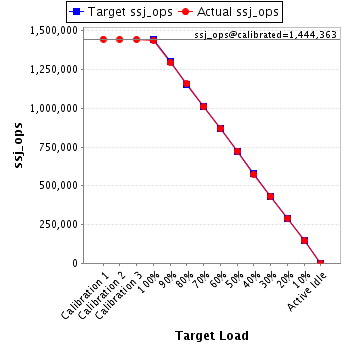
| ssj_ops@calibrated=1,444,363 | |||
| 100% | 99.5% | 1,444,363 | 1,437,454 |
| 90% | 89.7% | 1,299,927 | 1,295,037 |
| 80% | 80.2% | 1,155,491 | 1,158,649 |
| 70% | 69.9% | 1,011,054 | 1,009,671 |
| 60% | 60.2% | 866,618 | 868,975 |
| 50% | 50.1% | 722,182 | 724,249 |
| 40% | 39.8% | 577,745 | 574,843 |
| 30% | 29.9% | 433,309 | 432,471 |
| 20% | 20.0% | 288,873 | 288,935 |
| 10% | 10.0% | 144,436 | 145,005 |
| Active Idle | 0 | 0 | |
| Target Load | Actual Load | ssj_ops | |
|---|---|---|---|
| Target | Actual | ||
| Calibration 1 | 1,447,318 | ||
| Calibration 2 | 1,446,895 | ||
| Calibration 3 | 1,447,593 | ||
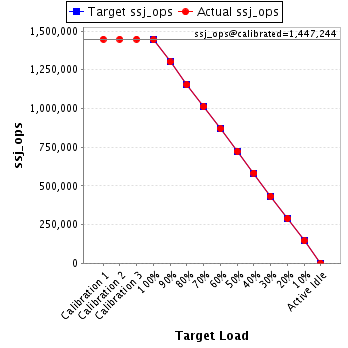
| ssj_ops@calibrated=1,447,244 | |||
| 100% | 99.8% | 1,447,244 | 1,443,932 |
| 90% | 89.9% | 1,302,519 | 1,300,645 |
| 80% | 79.7% | 1,157,795 | 1,153,243 |
| 70% | 69.9% | 1,013,071 | 1,012,295 |
| 60% | 60.0% | 868,346 | 868,954 |
| 50% | 49.9% | 723,622 | 722,742 |
| 40% | 40.3% | 578,897 | 582,808 |
| 30% | 30.0% | 434,173 | 433,502 |
| 20% | 20.0% | 289,449 | 289,130 |
| 10% | 10.1% | 144,724 | 145,618 |
| Active Idle | 0 | 0 | |