SPECpower_ssj2008
Host 'NODE05' Performance Report
Copyright © 2007-2019 Standard Performance Evaluation Corporation
| Hewlett Packard Enterprise Synergy 480 Gen10 Compute Module | ssj_ops@100% = 5,739,236 ssj_ops@100% per JVM = 1,434,809 |
||||
| Test Sponsor: | Hewlett Packard Enterprise | SPEC License #: | 3 | Test Method: | Multi Node |
| Tested By: | Hewlett Packard Enterprise | Test Location: | Houston, TX, USA | Test Date: | Mar 26, 2019 |
| Hardware Availability: | Apr-2019 | Software Availability: | Mar-2019 | Publication: | May 8, 2019 |
| System Source: | Single Supplier | System Designation: | Server | Power Provisioning: | Line-powered |
| Target Load | Actual Load | ssj_ops | |
|---|---|---|---|
| Target | Actual | ||
| Calibration 1 | 5,756,682 | ||
| Calibration 2 | 5,751,645 | ||
| Calibration 3 | 5,758,253 | ||
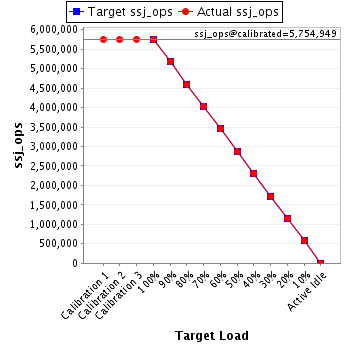
| ssj_ops@calibrated=5,754,949 | |||
| 100% | 99.7% | 5,754,949 | 5,739,236 |
| 90% | 89.9% | 5,179,454 | 5,175,501 |
| 80% | 79.8% | 4,603,959 | 4,594,089 |
| 70% | 70.0% | 4,028,464 | 4,031,093 |
| 60% | 60.0% | 3,452,969 | 3,450,649 |
| 50% | 49.8% | 2,877,474 | 2,865,364 |
| 40% | 40.0% | 2,301,979 | 2,303,566 |
| 30% | 29.9% | 1,726,485 | 1,722,536 |
| 20% | 19.9% | 1,150,990 | 1,148,066 |
| 10% | 10.0% | 575,495 | 576,611 |
| Active Idle | 0 | 0 | |
| Set Identifier: | SUT |
| Set Description: | System Under Test |
| # of Identical Nodes: | 11 |
| Comment: | SUT |
| Hardware | |
|---|---|
| Hardware Vendor: | Hewlett Packard Enterprise |
| Model: | Synergy 480 Gen10 Compute Module |
| Form Factor: | 7U |
| CPU Name: | Intel Xeon Platinum 8280 @ 2.70GHz (Intel Turbo Boost Technology up to 4.00 GHz) |
| CPU Characteristics: | 28-Core, 2.70 GHz, 38.5MB L3 Cache |
| CPU Frequency (MHz): | 2700 |
| CPU(s) Enabled: | 56 cores, 2 chips, 28 cores/chip |
| Hardware Threads: | 112 (2 / core) |
| CPU(s) Orderable: | 1,2 chips |
| Primary Cache: | 32 KB I + 32 KB D on chip per core |
| Secondary Cache: | 1 MB I+D on chip per core |
| Tertiary Cache: | 39424 KB I+D on chip per chip |
| Other Cache: | None |
| Memory Amount (GB): | 192 |
| # and size of DIMM: | 12 x 16384 MB |
| Memory Details: | 12 x 16GB 2Rx8 PC4-2933Y-R; slots 1, 3, 5, 8, 10 and 12 populated in each socket |
| Power Supply Quantity and Rating (W): | None |
| Power Supply Details: | N/A |
| Disk Drive: | 1 x HPE 240GB 6G SATA M.2 SSD (875488-B21) |
| Disk Controller: | HPE Smart Array S100i SR Gen10 |
| # and type of Network Interface Cards (NICs) Installed: | 1 x HPE Synergy 3820C 10/20Gb CNA |
| NICs Enabled in Firmware / OS / Connected: | 2/2/1 |
| Network Speed (Mbit): | 1000 |
| Keyboard: | None |
| Mouse: | None |
| Monitor: | None |
| Optical Drives: | No |
| Other Hardware: | H/S: Standard |
| Software | |
|---|---|
| Power Management: | Enabled (see SUT Notes) |
| Operating System (OS): | Windows Server 2012 R2 Datacenter |
| OS Version: | Version 6.3 (Build 9600) |
| Filesystem: | NTFS |
| JVM Vendor: | Oracle Corporation |
| JVM Version: | Oracle Java HotSpot(TM) 64-Bit Server VM (build 24.80-b11, mixed mode), version 1.7.0_80 |
| JVM Command-line Options: | -server -Xmn21000m -Xms24000m -Xmx24000m -XX:SurvivorRatio=1 -XX:TargetSurvivorRatio=99 -XX:AllocatePrefetchDistance=256 -XX:AllocatePrefetchLines=4 -XX:LoopUnrollLimit=45 -XX:InitialTenuringThreshold=12 -XX:MaxTenuringThreshold=15 -XX:ParallelGCThreads=28 -XX:InlineSmallCode=3900 -XX:MaxInlineSize=270 -XX:FreqInlineSize=2500 -XX:+AggressiveOpts -XX:+UseLargePages -XX:+UseParallelOldGC |
| JVM Affinity: | start /NODE [0,1,2,3] /AFFINITY [0xFFFFFFF] |
| JVM Instances: | 4 |
| JVM Initial Heap (MB): | 24000 |
| JVM Maximum Heap (MB): | 24000 |
| JVM Address Bits: | 64 |
| Boot Firmware Version: | I42 v2.00 (02/02/2019) |
| Management Firmware Version: | 1.40 Feb 05 2019 |
| Workload Version: | SSJ 1.2.10 |
| Director Location: | Controller |
| Other Software: | HPE Service Pack for ProLiant (SPP) Version: 2019.03.0, Microsoft Windows KB4056898, KB4338815 |
| JVM Instance | ssj_ops@100% |
|---|---|
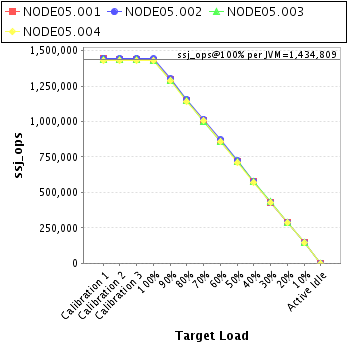
| NODE05.001 | 1,433,464 |
| NODE05.002 | 1,442,809 |
| NODE05.003 | 1,433,137 |
| NODE05.004 | 1,429,826 |
| ssj_ops@100% | 5,739,236 |
| ssj_ops@100% per JVM | 1,434,809 |
| Target Load | Actual Load | ssj_ops | |
|---|---|---|---|
| Target | Actual | ||
| Calibration 1 | 1,441,297 | ||
| Calibration 2 | 1,437,564 | ||
| Calibration 3 | 1,440,690 | ||
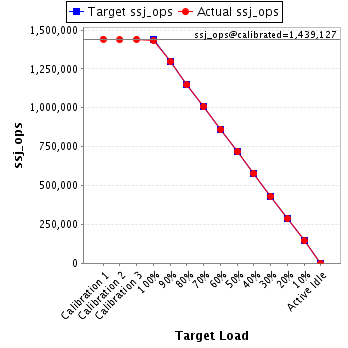
| ssj_ops@calibrated=1,439,127 | |||
| 100% | 99.6% | 1,439,127 | 1,433,464 |
| 90% | 90.1% | 1,295,214 | 1,297,322 |
| 80% | 79.7% | 1,151,301 | 1,147,245 |
| 70% | 70.0% | 1,007,389 | 1,007,726 |
| 60% | 59.8% | 863,476 | 860,544 |
| 50% | 49.8% | 719,563 | 717,036 |
| 40% | 40.1% | 575,651 | 577,709 |
| 30% | 30.0% | 431,738 | 431,233 |
| 20% | 20.0% | 287,825 | 287,950 |
| 10% | 10.0% | 143,913 | 144,416 |
| Active Idle | 0 | 0 | |
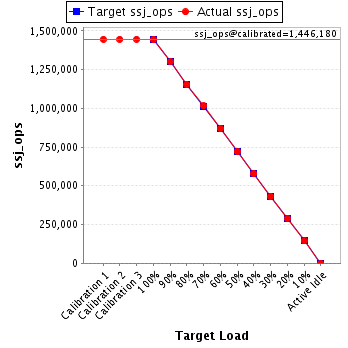
| Target Load | Actual Load | ssj_ops | |
|---|---|---|---|
| Target | Actual | ||
| Calibration 1 | 1,446,379 | ||
| Calibration 2 | 1,445,806 | ||
| Calibration 3 | 1,446,553 | ||
| ssj_ops@calibrated=1,446,180 | |||
| 100% | 99.8% | 1,446,180 | 1,442,809 |
| 90% | 89.9% | 1,301,562 | 1,299,750 |
| 80% | 79.9% | 1,156,944 | 1,155,725 |
| 70% | 70.2% | 1,012,326 | 1,015,937 |
| 60% | 60.2% | 867,708 | 870,279 |
| 50% | 49.9% | 723,090 | 722,250 |
| 40% | 40.0% | 578,472 | 577,821 |
| 30% | 29.8% | 433,854 | 431,572 |
| 20% | 20.0% | 289,236 | 289,233 |
| 10% | 9.9% | 144,618 | 143,770 |
| Active Idle | 0 | 0 | |
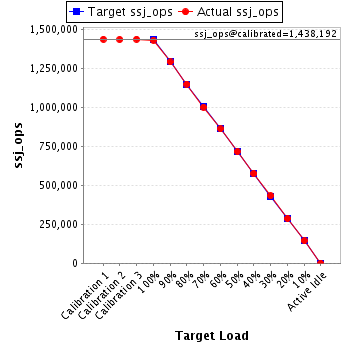
| Target Load | Actual Load | ssj_ops | |
|---|---|---|---|
| Target | Actual | ||
| Calibration 1 | 1,438,445 | ||
| Calibration 2 | 1,437,216 | ||
| Calibration 3 | 1,439,169 | ||
| ssj_ops@calibrated=1,438,192 | |||
| 100% | 99.6% | 1,438,192 | 1,433,137 |
| 90% | 89.9% | 1,294,373 | 1,292,637 |
| 80% | 80.0% | 1,150,554 | 1,150,791 |
| 70% | 69.8% | 1,006,735 | 1,003,375 |
| 60% | 60.0% | 862,915 | 862,365 |
| 50% | 49.8% | 719,096 | 716,775 |
| 40% | 40.0% | 575,277 | 575,392 |
| 30% | 30.1% | 431,458 | 432,584 |
| 20% | 19.9% | 287,638 | 286,355 |
| 10% | 10.1% | 143,819 | 144,963 |
| Active Idle | 0 | 0 | |
| Target Load | Actual Load | ssj_ops | |
|---|---|---|---|
| Target | Actual | ||
| Calibration 1 | 1,430,561 | ||
| Calibration 2 | 1,431,059 | ||
| Calibration 3 | 1,431,840 | ||
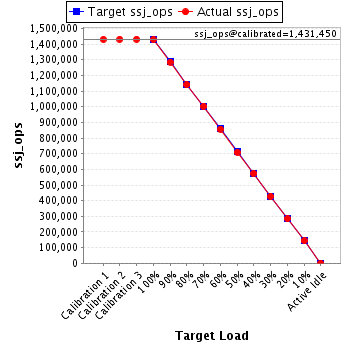
| ssj_ops@calibrated=1,431,450 | |||
| 100% | 99.9% | 1,431,450 | 1,429,826 |
| 90% | 89.8% | 1,288,305 | 1,285,792 |
| 80% | 79.7% | 1,145,160 | 1,140,328 |
| 70% | 70.1% | 1,002,015 | 1,004,055 |
| 60% | 59.9% | 858,870 | 857,462 |
| 50% | 49.6% | 715,725 | 709,303 |
| 40% | 40.0% | 572,580 | 572,644 |
| 30% | 29.8% | 429,435 | 427,147 |
| 20% | 19.9% | 286,290 | 284,527 |
| 10% | 10.0% | 143,145 | 143,462 |
| Active Idle | 0 | 0 | |