
SPECpower_ssj2008
Aggregate Performance Report
Copyright © 2007-2019 Standard Performance Evaluation Corporation
| Hewlett Packard Enterprise Synergy 480 Gen10 Compute Module | ssj_ops@100% = 51,793,120 ssj_ops@100% per Host = 5,754,791 ssj_ops@100% per JVM = 1,438,698 |
||||
| Test Sponsor: | Hewlett Packard Enterprise | SPEC License #: | 3 | Test Method: | Multi Node |
| Tested By: | Hewlett Packard Enterprise | Test Location: | Houston, TX, USA | Test Date: | Mar 26, 2019 |
| Hardware Availability: | Apr-2019 | Software Availability: | Mar-2019 | Publication: | May 8, 2019 |
| System Source: | Single Supplier | System Designation: | Server | Power Provisioning: | Line-powered |
| Target Load | Actual Load | ssj_ops | |
|---|---|---|---|
| Target | Actual | ||
| Calibration 1 | 51,963,705 | ||
| Calibration 2 | 51,910,384 | ||
| Calibration 3 | 51,962,435 | ||
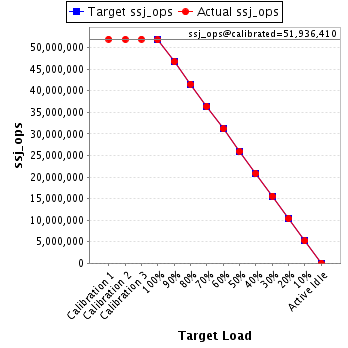
| ssj_ops@calibrated=51,936,410 | |||
| 100% | 99.7% | 51,936,410 | 51,793,120 |
| 90% | 90.0% | 46,742,769 | 46,757,453 |
| 80% | 80.0% | 41,549,128 | 41,561,329 |
| 70% | 70.0% | 36,355,487 | 36,347,226 |
| 60% | 60.0% | 31,161,846 | 31,164,091 |
| 50% | 50.0% | 25,968,205 | 25,960,015 |
| 40% | 40.0% | 20,774,564 | 20,778,537 |
| 30% | 30.0% | 15,580,923 | 15,585,606 |
| 20% | 20.0% | 10,387,282 | 10,381,893 |
| 10% | 10.0% | 5,193,641 | 5,190,473 |
| Active Idle | 0 | 0 | |
| # of Nodes | # of Chips | # of Cores | # of Threads | Total RAM (GB) | # of OS Images | # of JVM Instances |
|---|---|---|---|---|---|---|
| 9 | 18 | 504 | 1,008 | 1,728 | 9 | 36 |
| Set Identifier: | SUT |
| Set Description: | System Under Test |
| # of Identical Nodes: | 9 |
| Comment: | SUT |
| Hardware per Node | |
|---|---|
| Hardware Vendor: | Hewlett Packard Enterprise |
| Model: | Synergy 480 Gen10 Compute Module |
| Form Factor: | 7U |
| CPU Name: | Intel Xeon Platinum 8280 @ 2.70GHz (Intel Turbo Boost Technology up to 4.00 GHz) |
| CPU Characteristics: | 28-Core, 2.70 GHz, 38.5MB L3 Cache |
| CPU Frequency (MHz): | 2700 |
| CPU(s) Enabled: | 56 cores, 2 chips, 28 cores/chip |
| Hardware Threads: | 112 (2 / core) |
| CPU(s) Orderable: | 1,2 chips |
| Primary Cache: | 32 KB I + 32 KB D on chip per core |
| Secondary Cache: | 1 MB I+D on chip per core |
| Tertiary Cache: | 39424 KB I+D on chip per chip |
| Other Cache: | None |
| Memory Amount (GB): | 192 |
| # and size of DIMM: | 12 x 16384 MB |
| Memory Details: | 12 x 16GB 2Rx8 PC4-2933Y-R; slots 1, 3, 5, 8, 10 and 12 populated in each socket |
| Power Supply Quantity and Rating (W): | None |
| Power Supply Details: | N/A |
| Disk Drive: | 1 x HPE 240GB 6G SATA M.2 SSD (875488-B21) |
| Disk Controller: | HPE Smart Array S100i SR Gen10 |
| # and type of Network Interface Cards (NICs) Installed: | 1 x HPE Synergy 3820C 10/20Gb CNA |
| NICs Enabled in Firmware / OS / Connected: | 2/2/1 |
| Network Speed (Mbit): | 1000 |
| Keyboard: | None |
| Mouse: | None |
| Monitor: | None |
| Optical Drives: | No |
| Other Hardware: | H/S: Standard |
| Software per Node | |
|---|---|
| Power Management: | Enabled (see SUT Notes) |
| Operating System (OS): | Windows Server 2012 R2 Datacenter |
| OS Version: | Version 6.3 (Build 9600) |
| Filesystem: | NTFS |
| JVM Vendor: | Oracle Corporation |
| JVM Version: | Oracle Java HotSpot(TM) 64-Bit Server VM (build 24.80-b11, mixed mode), version 1.7.0_80 |
| JVM Command-line Options: | -server -Xmn21000m -Xms24000m -Xmx24000m -XX:SurvivorRatio=1 -XX:TargetSurvivorRatio=99 -XX:AllocatePrefetchDistance=256 -XX:AllocatePrefetchLines=4 -XX:LoopUnrollLimit=45 -XX:InitialTenuringThreshold=12 -XX:MaxTenuringThreshold=15 -XX:ParallelGCThreads=28 -XX:InlineSmallCode=3900 -XX:MaxInlineSize=270 -XX:FreqInlineSize=2500 -XX:+AggressiveOpts -XX:+UseLargePages -XX:+UseParallelOldGC |
| JVM Affinity: | start /NODE [0,1,2,3] /AFFINITY [0xFFFFFFF] |
| JVM Instances: | 4 |
| JVM Initial Heap (MB): | 24000 |
| JVM Maximum Heap (MB): | 24000 |
| JVM Address Bits: | 64 |
| Boot Firmware Version: | I42 v2.00 (02/02/2019) |
| Management Firmware Version: | 1.40 Feb 05 2019 |
| Workload Version: | SSJ 1.2.10 |
| Director Location: | Controller |
| Other Software: | HPE Service Pack for ProLiant (SPP) Version: 2019.03.0, Microsoft Windows KB4056898, KB4338815 |
| Host | ssj_ops@100% |
|---|---|
| NODE01 | 5,742,722 |
| NODE02 | 5,758,409 |
| NODE03 | 5,760,807 |
| NODE04 | 5,762,679 |
| NODE05 | 5,784,516 |
| NODE06 | 5,758,865 |
| NODE07 | 5,734,479 |
| NODE08 | 5,750,359 |
| NODE09 | 5,740,284 |
| ssj_ops@100% | 51,793,120 |
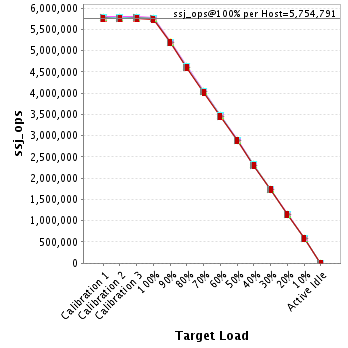
| ssj_ops@100% per Host | 5,754,791 |
| ssj_ops@100% per JVM | 1,438,698 |
| Target Load | Actual Load | ssj_ops | |
|---|---|---|---|
| Target | Actual | ||
| Calibration 1 | 5,763,355 | ||
| Calibration 2 | 5,761,728 | ||
| Calibration 3 | 5,763,451 | ||
| ssj_ops@calibrated=5,762,590 | |||
| 100% | 99.7% | 5,762,590 | 5,742,722 |
| 90% | 90.1% | 5,186,331 | 5,194,626 |
| 80% | 80.0% | 4,610,072 | 4,611,662 |
| 70% | 70.0% | 4,033,813 | 4,034,150 |
| 60% | 60.0% | 3,457,554 | 3,456,781 |
| 50% | 50.0% | 2,881,295 | 2,882,426 |
| 40% | 40.1% | 2,305,036 | 2,311,701 |
| 30% | 30.1% | 1,728,777 | 1,733,904 |
| 20% | 20.0% | 1,152,518 | 1,150,036 |
| 10% | 10.0% | 576,259 | 577,904 |
| Active Idle | 0 | 0 | |

| Target Load | Actual Load | ssj_ops | |
|---|---|---|---|
| Target | Actual | ||
| Calibration 1 | 5,782,756 | ||
| Calibration 2 | 5,775,228 | ||
| Calibration 3 | 5,775,442 | ||
| ssj_ops@calibrated=5,775,335 | |||
| 100% | 99.7% | 5,775,335 | 5,758,409 |
| 90% | 90.1% | 5,197,801 | 5,201,209 |
| 80% | 80.0% | 4,620,268 | 4,619,874 |
| 70% | 70.0% | 4,042,734 | 4,044,780 |
| 60% | 60.0% | 3,465,201 | 3,467,579 |
| 50% | 50.0% | 2,887,667 | 2,884,948 |
| 40% | 39.9% | 2,310,134 | 2,303,942 |
| 30% | 30.0% | 1,732,600 | 1,732,438 |
| 20% | 20.0% | 1,155,067 | 1,153,867 |
| 10% | 10.0% | 577,533 | 577,789 |
| Active Idle | 0 | 0 | |

| Target Load | Actual Load | ssj_ops | |
|---|---|---|---|
| Target | Actual | ||
| Calibration 1 | 5,781,331 | ||
| Calibration 2 | 5,776,133 | ||
| Calibration 3 | 5,780,823 | ||
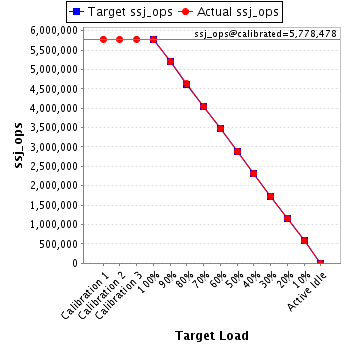
| ssj_ops@calibrated=5,778,478 | |||
| 100% | 99.7% | 5,778,478 | 5,760,807 |
| 90% | 90.0% | 5,200,630 | 5,199,530 |
| 80% | 80.0% | 4,622,782 | 4,625,326 |
| 70% | 69.9% | 4,044,935 | 4,039,422 |
| 60% | 60.0% | 3,467,087 | 3,469,631 |
| 50% | 50.0% | 2,889,239 | 2,887,636 |
| 40% | 40.0% | 2,311,391 | 2,310,925 |
| 30% | 30.0% | 1,733,543 | 1,730,843 |
| 20% | 20.0% | 1,155,696 | 1,153,898 |
| 10% | 10.0% | 577,848 | 578,425 |
| Active Idle | 0 | 0 | |
| Target Load | Actual Load | ssj_ops | |
|---|---|---|---|
| Target | Actual | ||
| Calibration 1 | 5,784,056 | ||
| Calibration 2 | 5,770,744 | ||
| Calibration 3 | 5,779,421 | ||
| ssj_ops@calibrated=5,775,082 | |||
| 100% | 99.8% | 5,775,082 | 5,762,679 |
| 90% | 90.1% | 5,197,574 | 5,202,099 |
| 80% | 80.2% | 4,620,066 | 4,630,244 |
| 70% | 69.9% | 4,042,558 | 4,039,664 |
| 60% | 59.9% | 3,465,049 | 3,461,061 |
| 50% | 50.0% | 2,887,541 | 2,885,165 |
| 40% | 40.0% | 2,310,033 | 2,312,544 |
| 30% | 30.0% | 1,732,525 | 1,730,871 |
| 20% | 20.0% | 1,155,016 | 1,154,064 |
| 10% | 10.0% | 577,508 | 576,504 |
| Active Idle | 0 | 0 | |

| Target Load | Actual Load | ssj_ops | |
|---|---|---|---|
| Target | Actual | ||
| Calibration 1 | 5,802,901 | ||
| Calibration 2 | 5,799,177 | ||
| Calibration 3 | 5,804,492 | ||
| ssj_ops@calibrated=5,801,835 | |||
| 100% | 99.7% | 5,801,835 | 5,784,516 |
| 90% | 90.0% | 5,221,651 | 5,218,956 |
| 80% | 80.0% | 4,641,468 | 4,640,960 |
| 70% | 70.1% | 4,061,284 | 4,066,157 |
| 60% | 60.0% | 3,481,101 | 3,480,213 |
| 50% | 50.0% | 2,900,917 | 2,898,898 |
| 40% | 40.0% | 2,320,734 | 2,319,145 |
| 30% | 30.0% | 1,740,550 | 1,741,744 |
| 20% | 20.0% | 1,160,367 | 1,160,251 |
| 10% | 10.0% | 580,183 | 579,101 |
| Active Idle | 0 | 0 | |

| Target Load | Actual Load | ssj_ops | |
|---|---|---|---|
| Target | Actual | ||
| Calibration 1 | 5,773,805 | ||
| Calibration 2 | 5,769,365 | ||
| Calibration 3 | 5,778,846 | ||
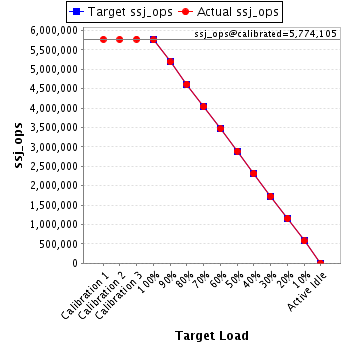
| ssj_ops@calibrated=5,774,105 | |||
| 100% | 99.7% | 5,774,105 | 5,758,865 |
| 90% | 89.9% | 5,196,695 | 5,192,632 |
| 80% | 79.9% | 4,619,284 | 4,614,709 |
| 70% | 70.0% | 4,041,874 | 4,039,712 |
| 60% | 60.0% | 3,464,463 | 3,464,989 |
| 50% | 50.1% | 2,887,053 | 2,891,196 |
| 40% | 40.0% | 2,309,642 | 2,311,367 |
| 30% | 30.0% | 1,732,232 | 1,732,852 |
| 20% | 20.0% | 1,154,821 | 1,156,294 |
| 10% | 10.0% | 577,411 | 574,851 |
| Active Idle | 0 | 0 | |
| Target Load | Actual Load | ssj_ops | |
|---|---|---|---|
| Target | Actual | ||
| Calibration 1 | 5,751,297 | ||
| Calibration 2 | 5,745,961 | ||
| Calibration 3 | 5,758,114 | ||
| ssj_ops@calibrated=5,752,038 | |||
| 100% | 99.7% | 5,752,038 | 5,734,479 |
| 90% | 90.0% | 5,176,834 | 5,174,652 |
| 80% | 80.1% | 4,601,630 | 4,604,668 |
| 70% | 70.0% | 4,026,426 | 4,026,902 |
| 60% | 60.0% | 3,451,223 | 3,453,209 |
| 50% | 49.9% | 2,876,019 | 2,871,242 |
| 40% | 40.0% | 2,300,815 | 2,301,931 |
| 30% | 30.0% | 1,725,611 | 1,724,743 |
| 20% | 20.0% | 1,150,408 | 1,149,752 |
| 10% | 10.0% | 575,204 | 575,899 |
| Active Idle | 0 | 0 | |

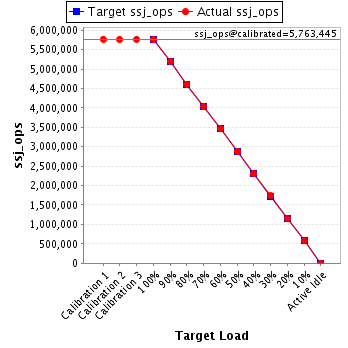
| Target Load | Actual Load | ssj_ops | |
|---|---|---|---|
| Target | Actual | ||
| Calibration 1 | 5,768,011 | ||
| Calibration 2 | 5,760,107 | ||
| Calibration 3 | 5,766,783 | ||
| ssj_ops@calibrated=5,763,445 | |||
| 100% | 99.8% | 5,763,445 | 5,750,359 |
| 90% | 90.1% | 5,187,101 | 5,193,680 |
| 80% | 80.0% | 4,610,756 | 4,611,266 |
| 70% | 70.0% | 4,034,412 | 4,035,008 |
| 60% | 60.0% | 3,458,067 | 3,457,607 |
| 50% | 50.0% | 2,881,723 | 2,882,920 |
| 40% | 40.0% | 2,305,378 | 2,304,910 |
| 30% | 30.1% | 1,729,034 | 1,732,490 |
| 20% | 20.0% | 1,152,689 | 1,151,485 |
| 10% | 10.0% | 576,345 | 575,828 |
| Active Idle | 0 | 0 | |
| Target Load | Actual Load | ssj_ops | |
|---|---|---|---|
| Target | Actual | ||
| Calibration 1 | 5,756,192 | ||
| Calibration 2 | 5,751,940 | ||
| Calibration 3 | 5,755,063 | ||
| ssj_ops@calibrated=5,753,501 | |||
| 100% | 99.8% | 5,753,501 | 5,740,284 |
| 90% | 90.0% | 5,178,151 | 5,180,070 |
| 80% | 80.0% | 4,602,801 | 4,602,620 |
| 70% | 69.9% | 4,027,451 | 4,021,431 |
| 60% | 60.0% | 3,452,101 | 3,453,021 |
| 50% | 50.0% | 2,876,751 | 2,875,584 |
| 40% | 40.0% | 2,301,401 | 2,302,073 |
| 30% | 30.0% | 1,726,050 | 1,725,721 |
| 20% | 20.0% | 1,150,700 | 1,152,246 |
| 10% | 10.0% | 575,350 | 574,174 |
| Active Idle | 0 | 0 | |
