SPECpower_ssj2008
Host 'NODE01' Performance Report
Copyright © 2007-2019 Standard Performance Evaluation Corporation
| Hewlett Packard Enterprise Synergy 480 Gen10 Compute Module | ssj_ops@100% = 5,737,791 ssj_ops@100% per JVM = 1,434,448 |
||||
| Test Sponsor: | Hewlett Packard Enterprise | SPEC License #: | 3 | Test Method: | Multi Node |
| Tested By: | Hewlett Packard Enterprise | Test Location: | Houston, TX, USA | Test Date: | Mar 26, 2019 |
| Hardware Availability: | Apr-2019 | Software Availability: | Mar-2019 | Publication: | May 8, 2019 |
| System Source: | Single Supplier | System Designation: | Server | Power Provisioning: | Line-powered |
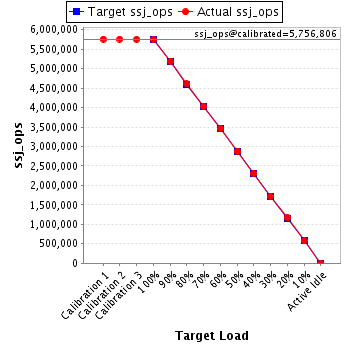
| Target Load | Actual Load | ssj_ops | |
|---|---|---|---|
| Target | Actual | ||
| Calibration 1 | 5,757,941 | ||
| Calibration 2 | 5,757,912 | ||
| Calibration 3 | 5,755,700 | ||
| ssj_ops@calibrated=5,756,806 | |||
| 100% | 99.7% | 5,756,806 | 5,737,791 |
| 90% | 90.1% | 5,181,125 | 5,186,192 |
| 80% | 80.0% | 4,605,445 | 4,606,370 |
| 70% | 70.0% | 4,029,764 | 4,030,574 |
| 60% | 60.1% | 3,454,084 | 3,458,970 |
| 50% | 49.9% | 2,878,403 | 2,873,929 |
| 40% | 40.1% | 2,302,722 | 2,310,346 |
| 30% | 30.0% | 1,727,042 | 1,725,034 |
| 20% | 20.3% | 1,151,361 | 1,170,031 |
| 10% | 10.0% | 575,681 | 575,948 |
| Active Idle | 0 | 0 | |
| Set Identifier: | SUT |
| Set Description: | System Under Test |
| # of Identical Nodes: | 8 |
| Comment: | SUT |
| Hardware | |
|---|---|
| Hardware Vendor: | Hewlett Packard Enterprise |
| Model: | Synergy 480 Gen10 Compute Module |
| Form Factor: | 7U |
| CPU Name: | Intel Xeon Platinum 8280 @ 2.70GHz (Intel Turbo Boost Technology up to 4.00 GHz) |
| CPU Characteristics: | 28-Core, 2.70 GHz, 38.5MB L3 Cache |
| CPU Frequency (MHz): | 2700 |
| CPU(s) Enabled: | 56 cores, 2 chips, 28 cores/chip |
| Hardware Threads: | 112 (2 / core) |
| CPU(s) Orderable: | 1,2 chips |
| Primary Cache: | 32 KB I + 32 KB D on chip per core |
| Secondary Cache: | 1 MB I+D on chip per core |
| Tertiary Cache: | 39424 KB I+D on chip per chip |
| Other Cache: | None |
| Memory Amount (GB): | 192 |
| # and size of DIMM: | 12 x 16384 MB |
| Memory Details: | 12 x 16GB 2Rx8 PC4-2933Y-R; slots 1, 3, 5, 8, 10 and 12 populated in each socket |
| Power Supply Quantity and Rating (W): | None |
| Power Supply Details: | N/A |
| Disk Drive: | 1 x HPE 240GB 6G SATA M.2 SSD (875488-B21) |
| Disk Controller: | HPE Smart Array S100i SR Gen10 |
| # and type of Network Interface Cards (NICs) Installed: | 1 x HPE Synergy 3820C 10/20Gb CNA |
| NICs Enabled in Firmware / OS / Connected: | 2/2/1 |
| Network Speed (Mbit): | 1000 |
| Keyboard: | None |
| Mouse: | None |
| Monitor: | None |
| Optical Drives: | No |
| Other Hardware: | H/S: Standard |
| Software | |
|---|---|
| Power Management: | Enabled (see SUT Notes) |
| Operating System (OS): | Windows Server 2012 R2 Datacenter |
| OS Version: | Version 6.3 (Build 9600) |
| Filesystem: | NTFS |
| JVM Vendor: | Oracle Corporation |
| JVM Version: | Oracle Java HotSpot(TM) 64-Bit Server VM (build 24.80-b11, mixed mode), version 1.7.0_80 |
| JVM Command-line Options: | -server -Xmn21000m -Xms24000m -Xmx24000m -XX:SurvivorRatio=1 -XX:TargetSurvivorRatio=99 -XX:AllocatePrefetchDistance=256 -XX:AllocatePrefetchLines=4 -XX:LoopUnrollLimit=45 -XX:InitialTenuringThreshold=12 -XX:MaxTenuringThreshold=15 -XX:ParallelGCThreads=28 -XX:InlineSmallCode=3900 -XX:MaxInlineSize=270 -XX:FreqInlineSize=2500 -XX:+AggressiveOpts -XX:+UseLargePages -XX:+UseParallelOldGC |
| JVM Affinity: | start /NODE [0,1,2,3] /AFFINITY [0xFFFFFFF] |
| JVM Instances: | 4 |
| JVM Initial Heap (MB): | 24000 |
| JVM Maximum Heap (MB): | 24000 |
| JVM Address Bits: | 64 |
| Boot Firmware Version: | I42 v2.00 (02/02/2019) |
| Management Firmware Version: | 1.40 Feb 05 2019 |
| Workload Version: | SSJ 1.2.10 |
| Director Location: | Controller |
| Other Software: | HPE Service Pack for ProLiant (SPP) Version: 2019.03.0, Microsoft Windows KB4056898, KB4338815 |
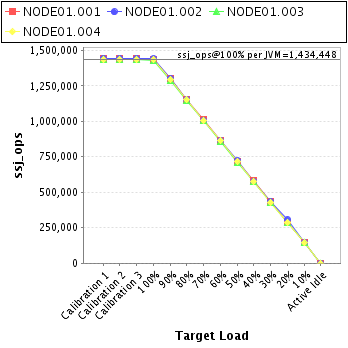
| JVM Instance | ssj_ops@100% |
|---|---|
| NODE01.001 | 1,437,662 |
| NODE01.002 | 1,440,224 |
| NODE01.003 | 1,426,515 |
| NODE01.004 | 1,433,390 |
| ssj_ops@100% | 5,737,791 |
| ssj_ops@100% per JVM | 1,434,448 |
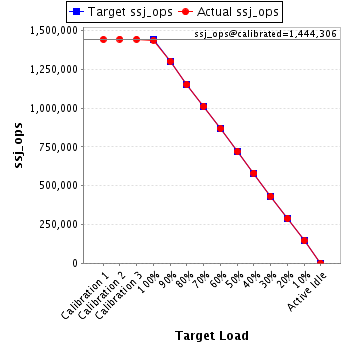
| Target Load | Actual Load | ssj_ops | |
|---|---|---|---|
| Target | Actual | ||
| Calibration 1 | 1,442,917 | ||
| Calibration 2 | 1,444,752 | ||
| Calibration 3 | 1,443,860 | ||
| ssj_ops@calibrated=1,444,306 | |||
| 100% | 99.5% | 1,444,306 | 1,437,662 |
| 90% | 90.2% | 1,299,875 | 1,302,306 |
| 80% | 79.8% | 1,155,445 | 1,152,070 |
| 70% | 70.1% | 1,011,014 | 1,012,266 |
| 60% | 60.1% | 866,584 | 868,176 |
| 50% | 49.9% | 722,153 | 720,372 |
| 40% | 40.3% | 577,722 | 581,355 |
| 30% | 30.0% | 433,292 | 432,734 |
| 20% | 20.0% | 288,861 | 288,988 |
| 10% | 10.1% | 144,431 | 145,748 |
| Active Idle | 0 | 0 | |
| Target Load | Actual Load | ssj_ops | |
|---|---|---|---|
| Target | Actual | ||
| Calibration 1 | 1,442,596 | ||
| Calibration 2 | 1,444,465 | ||
| Calibration 3 | 1,442,764 | ||
| ssj_ops@calibrated=1,443,615 | |||
| 100% | 99.8% | 1,443,615 | 1,440,224 |
| 90% | 90.1% | 1,299,253 | 1,300,382 |
| 80% | 80.0% | 1,154,892 | 1,154,655 |
| 70% | 69.8% | 1,010,530 | 1,008,063 |
| 60% | 60.0% | 866,169 | 866,332 |
| 50% | 50.0% | 721,807 | 722,186 |
| 40% | 40.1% | 577,446 | 578,972 |
| 30% | 29.9% | 433,084 | 431,868 |
| 20% | 21.2% | 288,723 | 305,671 |
| 10% | 9.9% | 144,361 | 143,520 |
| Active Idle | 0 | 0 | |

| Target Load | Actual Load | ssj_ops | |
|---|---|---|---|
| Target | Actual | ||
| Calibration 1 | 1,437,380 | ||
| Calibration 2 | 1,432,246 | ||
| Calibration 3 | 1,432,324 | ||
| ssj_ops@calibrated=1,432,285 | |||
| 100% | 99.6% | 1,432,285 | 1,426,515 |
| 90% | 90.1% | 1,289,056 | 1,289,852 |
| 80% | 80.2% | 1,145,828 | 1,148,396 |
| 70% | 70.2% | 1,002,599 | 1,005,449 |
| 60% | 60.0% | 859,371 | 859,545 |
| 50% | 49.8% | 716,142 | 712,990 |
| 40% | 40.0% | 572,914 | 573,525 |
| 30% | 30.0% | 429,685 | 430,388 |
| 20% | 20.1% | 286,457 | 287,686 |
| 10% | 10.0% | 143,228 | 142,817 |
| Active Idle | 0 | 0 | |

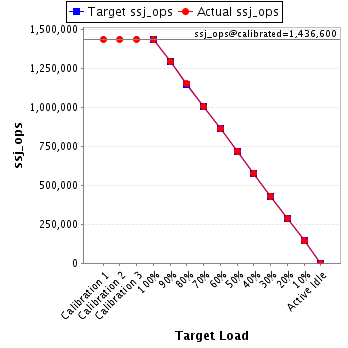
| Target Load | Actual Load | ssj_ops | |
|---|---|---|---|
| Target | Actual | ||
| Calibration 1 | 1,435,047 | ||
| Calibration 2 | 1,436,449 | ||
| Calibration 3 | 1,436,752 | ||
| ssj_ops@calibrated=1,436,600 | |||
| 100% | 99.8% | 1,436,600 | 1,433,390 |
| 90% | 90.0% | 1,292,940 | 1,293,652 |
| 80% | 80.1% | 1,149,280 | 1,151,248 |
| 70% | 69.9% | 1,005,620 | 1,004,796 |
| 60% | 60.2% | 861,960 | 864,917 |
| 50% | 50.0% | 718,300 | 718,382 |
| 40% | 40.1% | 574,640 | 576,494 |
| 30% | 29.9% | 430,980 | 430,045 |
| 20% | 20.0% | 287,320 | 287,686 |
| 10% | 10.0% | 143,660 | 143,862 |
| Active Idle | 0 | 0 | |