
SPECpower_ssj2008
Host 'NODE03' Performance Report
Copyright © 2007-2019 Standard Performance Evaluation Corporation
| Hewlett Packard Enterprise Synergy 480 Gen10 Compute Module | ssj_ops@100% = 5,772,636 ssj_ops@100% per JVM = 1,443,159 |
||||
| Test Sponsor: | Hewlett Packard Enterprise | SPEC License #: | 3 | Test Method: | Multi Node |
| Tested By: | Hewlett Packard Enterprise | Test Location: | Houston, TX, USA | Test Date: | Mar 26, 2019 |
| Hardware Availability: | Apr-2019 | Software Availability: | Mar-2019 | Publication: | May 8, 2019 |
| System Source: | Single Supplier | System Designation: | Server | Power Provisioning: | Line-powered |
| Target Load | Actual Load | ssj_ops | |
|---|---|---|---|
| Target | Actual | ||
| Calibration 1 | 5,804,048 | ||
| Calibration 2 | 5,785,295 | ||
| Calibration 3 | 5,788,878 | ||
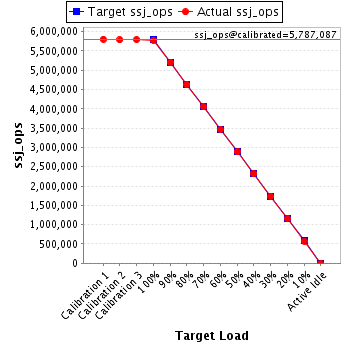
| ssj_ops@calibrated=5,787,087 | |||
| 100% | 99.8% | 5,787,087 | 5,772,636 |
| 90% | 89.9% | 5,208,378 | 5,204,864 |
| 80% | 80.0% | 4,629,669 | 4,629,000 |
| 70% | 70.1% | 4,050,961 | 4,054,318 |
| 60% | 59.9% | 3,472,252 | 3,468,933 |
| 50% | 49.9% | 2,893,543 | 2,886,317 |
| 40% | 40.0% | 2,314,835 | 2,314,390 |
| 30% | 30.1% | 1,736,126 | 1,739,080 |
| 20% | 20.0% | 1,157,417 | 1,156,148 |
| 10% | 10.0% | 578,709 | 576,071 |
| Active Idle | 0 | 0 | |
| Set Identifier: | SUT |
| Set Description: | System Under Test |
| # of Identical Nodes: | 8 |
| Comment: | SUT |
| Hardware | |
|---|---|
| Hardware Vendor: | Hewlett Packard Enterprise |
| Model: | Synergy 480 Gen10 Compute Module |
| Form Factor: | 7U |
| CPU Name: | Intel Xeon Platinum 8280 @ 2.70GHz (Intel Turbo Boost Technology up to 4.00 GHz) |
| CPU Characteristics: | 28-Core, 2.70 GHz, 38.5MB L3 Cache |
| CPU Frequency (MHz): | 2700 |
| CPU(s) Enabled: | 56 cores, 2 chips, 28 cores/chip |
| Hardware Threads: | 112 (2 / core) |
| CPU(s) Orderable: | 1,2 chips |
| Primary Cache: | 32 KB I + 32 KB D on chip per core |
| Secondary Cache: | 1 MB I+D on chip per core |
| Tertiary Cache: | 39424 KB I+D on chip per chip |
| Other Cache: | None |
| Memory Amount (GB): | 192 |
| # and size of DIMM: | 12 x 16384 MB |
| Memory Details: | 12 x 16GB 2Rx8 PC4-2933Y-R; slots 1, 3, 5, 8, 10 and 12 populated in each socket |
| Power Supply Quantity and Rating (W): | None |
| Power Supply Details: | N/A |
| Disk Drive: | 1 x HPE 240GB 6G SATA M.2 SSD (875488-B21) |
| Disk Controller: | HPE Smart Array S100i SR Gen10 |
| # and type of Network Interface Cards (NICs) Installed: | 1 x HPE Synergy 3820C 10/20Gb CNA |
| NICs Enabled in Firmware / OS / Connected: | 2/2/1 |
| Network Speed (Mbit): | 1000 |
| Keyboard: | None |
| Mouse: | None |
| Monitor: | None |
| Optical Drives: | No |
| Other Hardware: | H/S: Standard |
| Software | |
|---|---|
| Power Management: | Enabled (see SUT Notes) |
| Operating System (OS): | Windows Server 2012 R2 Datacenter |
| OS Version: | Version 6.3 (Build 9600) |
| Filesystem: | NTFS |
| JVM Vendor: | Oracle Corporation |
| JVM Version: | Oracle Java HotSpot(TM) 64-Bit Server VM (build 24.80-b11, mixed mode), version 1.7.0_80 |
| JVM Command-line Options: | -server -Xmn21000m -Xms24000m -Xmx24000m -XX:SurvivorRatio=1 -XX:TargetSurvivorRatio=99 -XX:AllocatePrefetchDistance=256 -XX:AllocatePrefetchLines=4 -XX:LoopUnrollLimit=45 -XX:InitialTenuringThreshold=12 -XX:MaxTenuringThreshold=15 -XX:ParallelGCThreads=28 -XX:InlineSmallCode=3900 -XX:MaxInlineSize=270 -XX:FreqInlineSize=2500 -XX:+AggressiveOpts -XX:+UseLargePages -XX:+UseParallelOldGC |
| JVM Affinity: | start /NODE [0,1,2,3] /AFFINITY [0xFFFFFFF] |
| JVM Instances: | 4 |
| JVM Initial Heap (MB): | 24000 |
| JVM Maximum Heap (MB): | 24000 |
| JVM Address Bits: | 64 |
| Boot Firmware Version: | I42 v2.00 (02/02/2019) |
| Management Firmware Version: | 1.40 Feb 05 2019 |
| Workload Version: | SSJ 1.2.10 |
| Director Location: | Controller |
| Other Software: | HPE Service Pack for ProLiant (SPP) Version: 2019.03.0, Microsoft Windows KB4056898, KB4338815 |
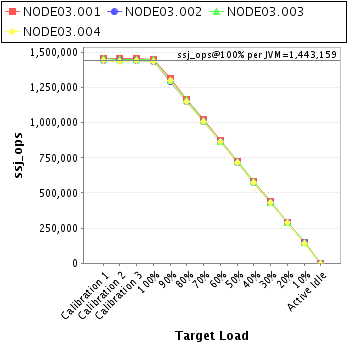
| JVM Instance | ssj_ops@100% |
|---|---|
| NODE03.001 | 1,451,457 |
| NODE03.002 | 1,435,687 |
| NODE03.003 | 1,448,003 |
| NODE03.004 | 1,437,488 |
| ssj_ops@100% | 5,772,636 |
| ssj_ops@100% per JVM | 1,443,159 |
| Target Load | Actual Load | ssj_ops | |
|---|---|---|---|
| Target | Actual | ||
| Calibration 1 | 1,458,963 | ||
| Calibration 2 | 1,456,107 | ||
| Calibration 3 | 1,457,830 | ||
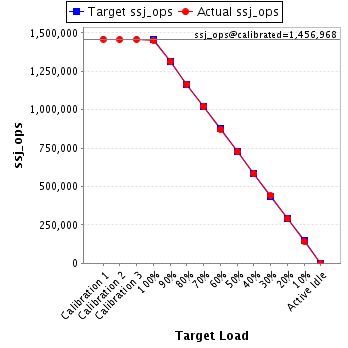
| ssj_ops@calibrated=1,456,968 | |||
| 100% | 99.6% | 1,456,968 | 1,451,457 |
| 90% | 90.1% | 1,311,272 | 1,312,781 |
| 80% | 80.0% | 1,165,575 | 1,166,295 |
| 70% | 70.2% | 1,019,878 | 1,022,487 |
| 60% | 59.8% | 874,181 | 871,296 |
| 50% | 49.8% | 728,484 | 725,853 |
| 40% | 39.9% | 582,787 | 581,845 |
| 30% | 30.2% | 437,091 | 439,713 |
| 20% | 19.9% | 291,394 | 289,851 |
| 10% | 9.9% | 145,697 | 144,421 |
| Active Idle | 0 | 0 | |
| Target Load | Actual Load | ssj_ops | |
|---|---|---|---|
| Target | Actual | ||
| Calibration 1 | 1,444,684 | ||
| Calibration 2 | 1,439,500 | ||
| Calibration 3 | 1,440,371 | ||
| ssj_ops@calibrated=1,439,935 | |||
| 100% | 99.7% | 1,439,935 | 1,435,687 |
| 90% | 89.7% | 1,295,942 | 1,292,158 |
| 80% | 79.9% | 1,151,948 | 1,150,708 |
| 70% | 70.0% | 1,007,955 | 1,008,387 |
| 60% | 60.1% | 863,961 | 865,268 |
| 50% | 49.8% | 719,968 | 716,783 |
| 40% | 39.9% | 575,974 | 574,887 |
| 30% | 30.1% | 431,981 | 433,686 |
| 20% | 20.0% | 287,987 | 288,242 |
| 10% | 10.0% | 143,994 | 144,159 |
| Active Idle | 0 | 0 | |

| Target Load | Actual Load | ssj_ops | |
|---|---|---|---|
| Target | Actual | ||
| Calibration 1 | 1,457,217 | ||
| Calibration 2 | 1,452,433 | ||
| Calibration 3 | 1,450,613 | ||
| ssj_ops@calibrated=1,451,523 | |||
| 100% | 99.8% | 1,451,523 | 1,448,003 |
| 90% | 89.7% | 1,306,371 | 1,302,114 |
| 80% | 80.1% | 1,161,218 | 1,163,365 |
| 70% | 70.0% | 1,016,066 | 1,015,521 |
| 60% | 59.9% | 870,914 | 869,345 |
| 50% | 50.0% | 725,762 | 725,648 |
| 40% | 40.0% | 580,609 | 581,153 |
| 30% | 29.8% | 435,457 | 432,821 |
| 20% | 20.0% | 290,305 | 289,916 |
| 10% | 10.0% | 145,152 | 144,897 |
| Active Idle | 0 | 0 | |

| Target Load | Actual Load | ssj_ops | |
|---|---|---|---|
| Target | Actual | ||
| Calibration 1 | 1,443,184 | ||
| Calibration 2 | 1,437,255 | ||
| Calibration 3 | 1,440,065 | ||
| ssj_ops@calibrated=1,438,660 | |||
| 100% | 99.9% | 1,438,660 | 1,437,488 |
| 90% | 90.2% | 1,294,794 | 1,297,811 |
| 80% | 79.8% | 1,150,928 | 1,148,631 |
| 70% | 70.1% | 1,007,062 | 1,007,923 |
| 60% | 60.0% | 863,196 | 863,024 |
| 50% | 49.9% | 719,330 | 718,033 |
| 40% | 40.1% | 575,464 | 576,504 |
| 30% | 30.1% | 431,598 | 432,861 |
| 20% | 20.0% | 287,732 | 288,138 |
| 10% | 9.9% | 143,866 | 142,594 |
| Active Idle | 0 | 0 | |
