SPECpower_ssj2008
Host 'NODE04' Performance Report
Copyright © 2007-2019 Standard Performance Evaluation Corporation
| Hewlett Packard Enterprise Synergy 480 Gen10 Compute Module | ssj_ops@100% = 5,745,707 ssj_ops@100% per JVM = 1,436,427 |
||||
| Test Sponsor: | Hewlett Packard Enterprise | SPEC License #: | 3 | Test Method: | Multi Node |
| Tested By: | Hewlett Packard Enterprise | Test Location: | Houston, TX, USA | Test Date: | Mar 26, 2019 |
| Hardware Availability: | Apr-2019 | Software Availability: | Mar-2019 | Publication: | May 8, 2019 |
| System Source: | Single Supplier | System Designation: | Server | Power Provisioning: | Line-powered |
| Target Load | Actual Load | ssj_ops | |
|---|---|---|---|
| Target | Actual | ||
| Calibration 1 | 5,770,539 | ||
| Calibration 2 | 5,762,156 | ||
| Calibration 3 | 5,764,503 | ||
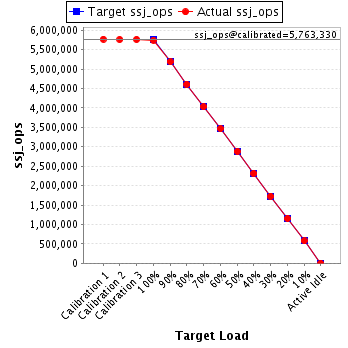
| ssj_ops@calibrated=5,763,330 | |||
| 100% | 99.7% | 5,763,330 | 5,745,707 |
| 90% | 90.0% | 5,186,997 | 5,187,874 |
| 80% | 80.0% | 4,610,664 | 4,610,773 |
| 70% | 69.9% | 4,034,331 | 4,030,196 |
| 60% | 60.1% | 3,457,998 | 3,463,478 |
| 50% | 50.0% | 2,881,665 | 2,881,947 |
| 40% | 40.1% | 2,305,332 | 2,311,979 |
| 30% | 30.0% | 1,728,999 | 1,728,622 |
| 20% | 20.0% | 1,152,666 | 1,151,699 |
| 10% | 10.0% | 576,333 | 575,666 |
| Active Idle | 0 | 0 | |
| Set Identifier: | SUT |
| Set Description: | System Under Test |
| # of Identical Nodes: | 8 |
| Comment: | SUT |
| Hardware | |
|---|---|
| Hardware Vendor: | Hewlett Packard Enterprise |
| Model: | Synergy 480 Gen10 Compute Module |
| Form Factor: | 7U |
| CPU Name: | Intel Xeon Platinum 8280 @ 2.70GHz (Intel Turbo Boost Technology up to 4.00 GHz) |
| CPU Characteristics: | 28-Core, 2.70 GHz, 38.5MB L3 Cache |
| CPU Frequency (MHz): | 2700 |
| CPU(s) Enabled: | 56 cores, 2 chips, 28 cores/chip |
| Hardware Threads: | 112 (2 / core) |
| CPU(s) Orderable: | 1,2 chips |
| Primary Cache: | 32 KB I + 32 KB D on chip per core |
| Secondary Cache: | 1 MB I+D on chip per core |
| Tertiary Cache: | 39424 KB I+D on chip per chip |
| Other Cache: | None |
| Memory Amount (GB): | 192 |
| # and size of DIMM: | 12 x 16384 MB |
| Memory Details: | 12 x 16GB 2Rx8 PC4-2933Y-R; slots 1, 3, 5, 8, 10 and 12 populated in each socket |
| Power Supply Quantity and Rating (W): | None |
| Power Supply Details: | N/A |
| Disk Drive: | 1 x HPE 240GB 6G SATA M.2 SSD (875488-B21) |
| Disk Controller: | HPE Smart Array S100i SR Gen10 |
| # and type of Network Interface Cards (NICs) Installed: | 1 x HPE Synergy 3820C 10/20Gb CNA |
| NICs Enabled in Firmware / OS / Connected: | 2/2/1 |
| Network Speed (Mbit): | 1000 |
| Keyboard: | None |
| Mouse: | None |
| Monitor: | None |
| Optical Drives: | No |
| Other Hardware: | H/S: Standard |
| Software | |
|---|---|
| Power Management: | Enabled (see SUT Notes) |
| Operating System (OS): | Windows Server 2012 R2 Datacenter |
| OS Version: | Version 6.3 (Build 9600) |
| Filesystem: | NTFS |
| JVM Vendor: | Oracle Corporation |
| JVM Version: | Oracle Java HotSpot(TM) 64-Bit Server VM (build 24.80-b11, mixed mode), version 1.7.0_80 |
| JVM Command-line Options: | -server -Xmn21000m -Xms24000m -Xmx24000m -XX:SurvivorRatio=1 -XX:TargetSurvivorRatio=99 -XX:AllocatePrefetchDistance=256 -XX:AllocatePrefetchLines=4 -XX:LoopUnrollLimit=45 -XX:InitialTenuringThreshold=12 -XX:MaxTenuringThreshold=15 -XX:ParallelGCThreads=28 -XX:InlineSmallCode=3900 -XX:MaxInlineSize=270 -XX:FreqInlineSize=2500 -XX:+AggressiveOpts -XX:+UseLargePages -XX:+UseParallelOldGC |
| JVM Affinity: | start /NODE [0,1,2,3] /AFFINITY [0xFFFFFFF] |
| JVM Instances: | 4 |
| JVM Initial Heap (MB): | 24000 |
| JVM Maximum Heap (MB): | 24000 |
| JVM Address Bits: | 64 |
| Boot Firmware Version: | I42 v2.00 (02/02/2019) |
| Management Firmware Version: | 1.40 Feb 05 2019 |
| Workload Version: | SSJ 1.2.10 |
| Director Location: | Controller |
| Other Software: | HPE Service Pack for ProLiant (SPP) Version: 2019.03.0, Microsoft Windows KB4056898, KB4338815 |
| JVM Instance | ssj_ops@100% |
|---|---|
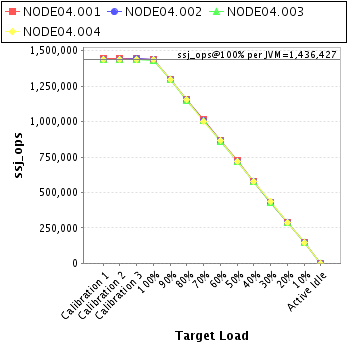
| NODE04.001 | 1,439,236 |
| NODE04.002 | 1,437,011 |
| NODE04.003 | 1,433,655 |
| NODE04.004 | 1,435,804 |
| ssj_ops@100% | 5,745,707 |
| ssj_ops@100% per JVM | 1,436,427 |
| Target Load | Actual Load | ssj_ops | |
|---|---|---|---|
| Target | Actual | ||
| Calibration 1 | 1,447,773 | ||
| Calibration 2 | 1,444,626 | ||
| Calibration 3 | 1,444,369 | ||
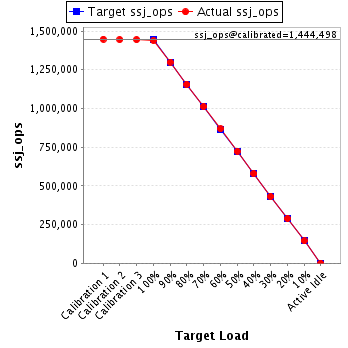
| ssj_ops@calibrated=1,444,498 | |||
| 100% | 99.6% | 1,444,498 | 1,439,236 |
| 90% | 90.0% | 1,300,048 | 1,300,085 |
| 80% | 80.0% | 1,155,598 | 1,155,742 |
| 70% | 70.1% | 1,011,148 | 1,012,870 |
| 60% | 60.1% | 866,699 | 867,939 |
| 50% | 50.1% | 722,249 | 723,874 |
| 40% | 40.0% | 577,799 | 578,133 |
| 30% | 29.8% | 433,349 | 431,117 |
| 20% | 20.0% | 288,900 | 288,612 |
| 10% | 10.0% | 144,450 | 144,616 |
| Active Idle | 0 | 0 | |
| Target Load | Actual Load | ssj_ops | |
|---|---|---|---|
| Target | Actual | ||
| Calibration 1 | 1,441,096 | ||
| Calibration 2 | 1,440,689 | ||
| Calibration 3 | 1,442,561 | ||
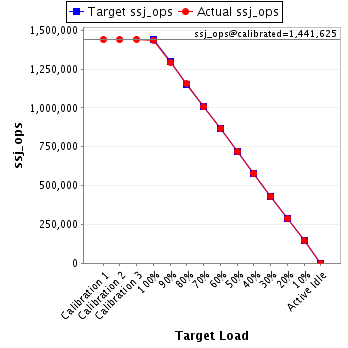
| ssj_ops@calibrated=1,441,625 | |||
| 100% | 99.7% | 1,441,625 | 1,437,011 |
| 90% | 89.8% | 1,297,462 | 1,294,755 |
| 80% | 80.1% | 1,153,300 | 1,154,451 |
| 70% | 69.8% | 1,009,137 | 1,006,783 |
| 60% | 60.1% | 864,975 | 866,283 |
| 50% | 49.9% | 720,812 | 719,476 |
| 40% | 40.1% | 576,650 | 577,646 |
| 30% | 30.0% | 432,487 | 432,101 |
| 20% | 20.0% | 288,325 | 288,972 |
| 10% | 10.0% | 144,162 | 143,845 |
| Active Idle | 0 | 0 | |
| Target Load | Actual Load | ssj_ops | |
|---|---|---|---|
| Target | Actual | ||
| Calibration 1 | 1,440,007 | ||
| Calibration 2 | 1,436,426 | ||
| Calibration 3 | 1,436,830 | ||
| ssj_ops@calibrated=1,436,628 | |||
| 100% | 99.8% | 1,436,628 | 1,433,655 |
| 90% | 90.2% | 1,292,965 | 1,295,284 |
| 80% | 79.9% | 1,149,302 | 1,147,871 |
| 70% | 70.1% | 1,005,640 | 1,006,417 |
| 60% | 59.9% | 861,977 | 860,556 |
| 50% | 50.0% | 718,314 | 718,308 |
| 40% | 40.2% | 574,651 | 577,099 |
| 30% | 30.1% | 430,988 | 431,836 |
| 20% | 20.0% | 287,326 | 287,758 |
| 10% | 10.0% | 143,663 | 144,096 |
| Active Idle | 0 | 0 | |

| Target Load | Actual Load | ssj_ops | |
|---|---|---|---|
| Target | Actual | ||
| Calibration 1 | 1,441,663 | ||
| Calibration 2 | 1,440,416 | ||
| Calibration 3 | 1,440,743 | ||
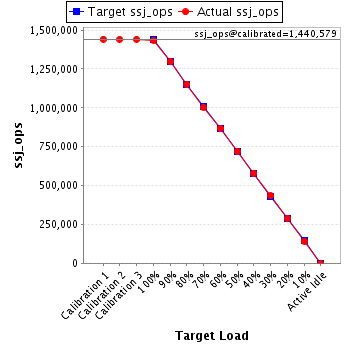
| ssj_ops@calibrated=1,440,579 | |||
| 100% | 99.7% | 1,440,579 | 1,435,804 |
| 90% | 90.1% | 1,296,521 | 1,297,750 |
| 80% | 80.0% | 1,152,464 | 1,152,710 |
| 70% | 69.7% | 1,008,406 | 1,004,126 |
| 60% | 60.3% | 864,348 | 868,699 |
| 50% | 50.0% | 720,290 | 720,289 |
| 40% | 40.2% | 576,232 | 579,102 |
| 30% | 30.1% | 432,174 | 433,568 |
| 20% | 19.9% | 288,116 | 286,356 |
| 10% | 9.9% | 144,058 | 143,109 |
| Active Idle | 0 | 0 | |