SPECpower_ssj2008
Host 'NODE07' Performance Report
Copyright © 2007-2019 Standard Performance Evaluation Corporation
| Hewlett Packard Enterprise Synergy 480 Gen10 Compute Module | ssj_ops@100% = 5,731,526 ssj_ops@100% per JVM = 1,432,882 |
||||
| Test Sponsor: | Hewlett Packard Enterprise | SPEC License #: | 3 | Test Method: | Multi Node |
| Tested By: | Hewlett Packard Enterprise | Test Location: | Houston, TX, USA | Test Date: | Mar 26, 2019 |
| Hardware Availability: | Apr-2019 | Software Availability: | Mar-2019 | Publication: | May 8, 2019 |
| System Source: | Single Supplier | System Designation: | Server | Power Provisioning: | Line-powered |
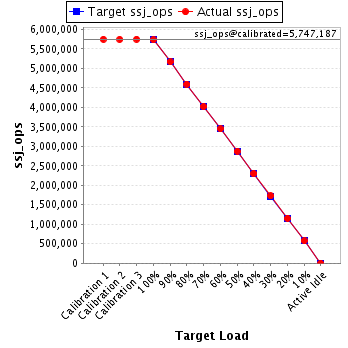
| Target Load | Actual Load | ssj_ops | |
|---|---|---|---|
| Target | Actual | ||
| Calibration 1 | 5,747,111 | ||
| Calibration 2 | 5,743,828 | ||
| Calibration 3 | 5,750,546 | ||
| ssj_ops@calibrated=5,747,187 | |||
| 100% | 99.7% | 5,747,187 | 5,731,526 |
| 90% | 89.9% | 5,172,468 | 5,166,536 |
| 80% | 80.0% | 4,597,750 | 4,597,446 |
| 70% | 70.0% | 4,023,031 | 4,023,758 |
| 60% | 60.0% | 3,448,312 | 3,446,081 |
| 50% | 50.1% | 2,873,594 | 2,876,724 |
| 40% | 40.0% | 2,298,875 | 2,298,461 |
| 30% | 30.0% | 1,724,156 | 1,726,363 |
| 20% | 20.1% | 1,149,437 | 1,153,726 |
| 10% | 10.0% | 574,719 | 574,357 |
| Active Idle | 0 | 0 | |
| Set Identifier: | SUT |
| Set Description: | System Under Test |
| # of Identical Nodes: | 8 |
| Comment: | SUT |
| Hardware | |
|---|---|
| Hardware Vendor: | Hewlett Packard Enterprise |
| Model: | Synergy 480 Gen10 Compute Module |
| Form Factor: | 7U |
| CPU Name: | Intel Xeon Platinum 8280 @ 2.70GHz (Intel Turbo Boost Technology up to 4.00 GHz) |
| CPU Characteristics: | 28-Core, 2.70 GHz, 38.5MB L3 Cache |
| CPU Frequency (MHz): | 2700 |
| CPU(s) Enabled: | 56 cores, 2 chips, 28 cores/chip |
| Hardware Threads: | 112 (2 / core) |
| CPU(s) Orderable: | 1,2 chips |
| Primary Cache: | 32 KB I + 32 KB D on chip per core |
| Secondary Cache: | 1 MB I+D on chip per core |
| Tertiary Cache: | 39424 KB I+D on chip per chip |
| Other Cache: | None |
| Memory Amount (GB): | 192 |
| # and size of DIMM: | 12 x 16384 MB |
| Memory Details: | 12 x 16GB 2Rx8 PC4-2933Y-R; slots 1, 3, 5, 8, 10 and 12 populated in each socket |
| Power Supply Quantity and Rating (W): | None |
| Power Supply Details: | N/A |
| Disk Drive: | 1 x HPE 240GB 6G SATA M.2 SSD (875488-B21) |
| Disk Controller: | HPE Smart Array S100i SR Gen10 |
| # and type of Network Interface Cards (NICs) Installed: | 1 x HPE Synergy 3820C 10/20Gb CNA |
| NICs Enabled in Firmware / OS / Connected: | 2/2/1 |
| Network Speed (Mbit): | 1000 |
| Keyboard: | None |
| Mouse: | None |
| Monitor: | None |
| Optical Drives: | No |
| Other Hardware: | H/S: Standard |
| Software | |
|---|---|
| Power Management: | Enabled (see SUT Notes) |
| Operating System (OS): | Windows Server 2012 R2 Datacenter |
| OS Version: | Version 6.3 (Build 9600) |
| Filesystem: | NTFS |
| JVM Vendor: | Oracle Corporation |
| JVM Version: | Oracle Java HotSpot(TM) 64-Bit Server VM (build 24.80-b11, mixed mode), version 1.7.0_80 |
| JVM Command-line Options: | -server -Xmn21000m -Xms24000m -Xmx24000m -XX:SurvivorRatio=1 -XX:TargetSurvivorRatio=99 -XX:AllocatePrefetchDistance=256 -XX:AllocatePrefetchLines=4 -XX:LoopUnrollLimit=45 -XX:InitialTenuringThreshold=12 -XX:MaxTenuringThreshold=15 -XX:ParallelGCThreads=28 -XX:InlineSmallCode=3900 -XX:MaxInlineSize=270 -XX:FreqInlineSize=2500 -XX:+AggressiveOpts -XX:+UseLargePages -XX:+UseParallelOldGC |
| JVM Affinity: | start /NODE [0,1,2,3] /AFFINITY [0xFFFFFFF] |
| JVM Instances: | 4 |
| JVM Initial Heap (MB): | 24000 |
| JVM Maximum Heap (MB): | 24000 |
| JVM Address Bits: | 64 |
| Boot Firmware Version: | I42 v2.00 (02/02/2019) |
| Management Firmware Version: | 1.40 Feb 05 2019 |
| Workload Version: | SSJ 1.2.10 |
| Director Location: | Controller |
| Other Software: | HPE Service Pack for ProLiant (SPP) Version: 2019.03.0, Microsoft Windows KB4056898, KB4338815 |
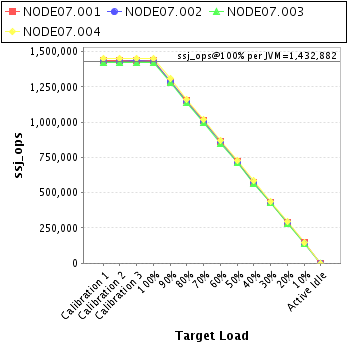
| JVM Instance | ssj_ops@100% |
|---|---|
| NODE07.001 | 1,435,709 |
| NODE07.002 | 1,427,945 |
| NODE07.003 | 1,419,870 |
| NODE07.004 | 1,448,003 |
| ssj_ops@100% | 5,731,526 |
| ssj_ops@100% per JVM | 1,432,882 |
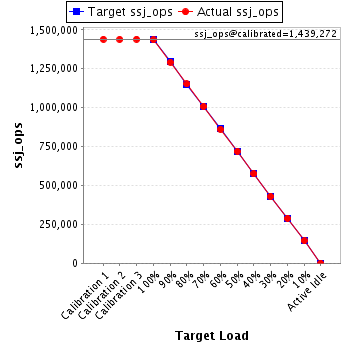
| Target Load | Actual Load | ssj_ops | |
|---|---|---|---|
| Target | Actual | ||
| Calibration 1 | 1,439,338 | ||
| Calibration 2 | 1,438,435 | ||
| Calibration 3 | 1,440,110 | ||
| ssj_ops@calibrated=1,439,272 | |||
| 100% | 99.8% | 1,439,272 | 1,435,709 |
| 90% | 89.8% | 1,295,345 | 1,291,790 |
| 80% | 80.1% | 1,151,418 | 1,152,267 |
| 70% | 70.1% | 1,007,491 | 1,008,306 |
| 60% | 59.8% | 863,563 | 861,126 |
| 50% | 50.0% | 719,636 | 719,398 |
| 40% | 39.9% | 575,709 | 574,124 |
| 30% | 29.9% | 431,782 | 429,704 |
| 20% | 20.1% | 287,854 | 288,716 |
| 10% | 10.0% | 143,927 | 144,605 |
| Active Idle | 0 | 0 | |
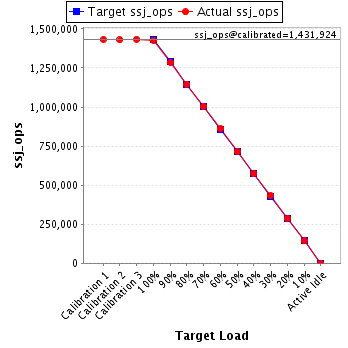
| Target Load | Actual Load | ssj_ops | |
|---|---|---|---|
| Target | Actual | ||
| Calibration 1 | 1,432,294 | ||
| Calibration 2 | 1,429,690 | ||
| Calibration 3 | 1,434,158 | ||
| ssj_ops@calibrated=1,431,924 | |||
| 100% | 99.7% | 1,431,924 | 1,427,945 |
| 90% | 89.8% | 1,288,732 | 1,285,943 |
| 80% | 80.0% | 1,145,539 | 1,145,621 |
| 70% | 70.1% | 1,002,347 | 1,003,883 |
| 60% | 60.1% | 859,154 | 860,897 |
| 50% | 50.0% | 715,962 | 716,223 |
| 40% | 40.0% | 572,770 | 572,663 |
| 30% | 30.1% | 429,577 | 430,686 |
| 20% | 20.1% | 286,385 | 287,103 |
| 10% | 10.0% | 143,192 | 143,017 |
| Active Idle | 0 | 0 | |
| Target Load | Actual Load | ssj_ops | |
|---|---|---|---|
| Target | Actual | ||
| Calibration 1 | 1,424,541 | ||
| Calibration 2 | 1,424,339 | ||
| Calibration 3 | 1,422,742 | ||
| ssj_ops@calibrated=1,423,540 | |||
| 100% | 99.7% | 1,423,540 | 1,419,870 |
| 90% | 89.9% | 1,281,186 | 1,279,982 |
| 80% | 79.9% | 1,138,832 | 1,137,294 |
| 70% | 69.9% | 996,478 | 994,547 |
| 60% | 59.8% | 854,124 | 851,190 |
| 50% | 50.2% | 711,770 | 714,358 |
| 40% | 39.9% | 569,416 | 568,350 |
| 30% | 30.2% | 427,062 | 429,970 |
| 20% | 20.0% | 284,708 | 284,534 |
| 10% | 10.0% | 142,354 | 141,913 |
| Active Idle | 0 | 0 | |

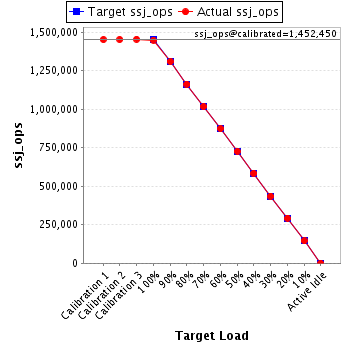
| Target Load | Actual Load | ssj_ops | |
|---|---|---|---|
| Target | Actual | ||
| Calibration 1 | 1,450,938 | ||
| Calibration 2 | 1,451,365 | ||
| Calibration 3 | 1,453,536 | ||
| ssj_ops@calibrated=1,452,450 | |||
| 100% | 99.7% | 1,452,450 | 1,448,003 |
| 90% | 90.1% | 1,307,205 | 1,308,821 |
| 80% | 80.0% | 1,161,960 | 1,162,265 |
| 70% | 70.0% | 1,016,715 | 1,017,023 |
| 60% | 60.1% | 871,470 | 872,868 |
| 50% | 50.0% | 726,225 | 726,746 |
| 40% | 40.2% | 580,980 | 583,323 |
| 30% | 30.0% | 435,735 | 436,004 |
| 20% | 20.2% | 290,490 | 293,374 |
| 10% | 10.0% | 145,245 | 144,822 |
| Active Idle | 0 | 0 | |