
SPECpower_ssj2008
Host 'NODE08' Performance Report
Copyright © 2007-2019 Standard Performance Evaluation Corporation
| Hewlett Packard Enterprise Synergy 480 Gen10 Compute Module | ssj_ops@100% = 5,752,998 ssj_ops@100% per JVM = 1,438,249 |
||||
| Test Sponsor: | Hewlett Packard Enterprise | SPEC License #: | 3 | Test Method: | Multi Node |
| Tested By: | Hewlett Packard Enterprise | Test Location: | Houston, TX, USA | Test Date: | Mar 26, 2019 |
| Hardware Availability: | Apr-2019 | Software Availability: | Mar-2019 | Publication: | May 8, 2019 |
| System Source: | Single Supplier | System Designation: | Server | Power Provisioning: | Line-powered |
| Target Load | Actual Load | ssj_ops | |
|---|---|---|---|
| Target | Actual | ||
| Calibration 1 | 5,771,132 | ||
| Calibration 2 | 5,764,353 | ||
| Calibration 3 | 5,768,713 | ||
| ssj_ops@calibrated=5,766,533 | |||
| 100% | 99.8% | 5,766,533 | 5,752,998 |
| 90% | 90.0% | 5,189,880 | 5,190,631 |
| 80% | 80.0% | 4,613,226 | 4,613,476 |
| 70% | 70.0% | 4,036,573 | 4,034,229 |
| 60% | 59.9% | 3,459,920 | 3,451,828 |
| 50% | 50.0% | 2,883,267 | 2,884,414 |
| 40% | 40.0% | 2,306,613 | 2,309,422 |
| 30% | 30.0% | 1,729,960 | 1,729,182 |
| 20% | 20.0% | 1,153,307 | 1,153,074 |
| 10% | 10.0% | 576,653 | 577,388 |
| Active Idle | 0 | 0 | |

| Set Identifier: | SUT |
| Set Description: | System Under Test |
| # of Identical Nodes: | 8 |
| Comment: | SUT |
| Hardware | |
|---|---|
| Hardware Vendor: | Hewlett Packard Enterprise |
| Model: | Synergy 480 Gen10 Compute Module |
| Form Factor: | 7U |
| CPU Name: | Intel Xeon Platinum 8280 @ 2.70GHz (Intel Turbo Boost Technology up to 4.00 GHz) |
| CPU Characteristics: | 28-Core, 2.70 GHz, 38.5MB L3 Cache |
| CPU Frequency (MHz): | 2700 |
| CPU(s) Enabled: | 56 cores, 2 chips, 28 cores/chip |
| Hardware Threads: | 112 (2 / core) |
| CPU(s) Orderable: | 1,2 chips |
| Primary Cache: | 32 KB I + 32 KB D on chip per core |
| Secondary Cache: | 1 MB I+D on chip per core |
| Tertiary Cache: | 39424 KB I+D on chip per chip |
| Other Cache: | None |
| Memory Amount (GB): | 192 |
| # and size of DIMM: | 12 x 16384 MB |
| Memory Details: | 12 x 16GB 2Rx8 PC4-2933Y-R; slots 1, 3, 5, 8, 10 and 12 populated in each socket |
| Power Supply Quantity and Rating (W): | None |
| Power Supply Details: | N/A |
| Disk Drive: | 1 x HPE 240GB 6G SATA M.2 SSD (875488-B21) |
| Disk Controller: | HPE Smart Array S100i SR Gen10 |
| # and type of Network Interface Cards (NICs) Installed: | 1 x HPE Synergy 3820C 10/20Gb CNA |
| NICs Enabled in Firmware / OS / Connected: | 2/2/1 |
| Network Speed (Mbit): | 1000 |
| Keyboard: | None |
| Mouse: | None |
| Monitor: | None |
| Optical Drives: | No |
| Other Hardware: | H/S: Standard |
| Software | |
|---|---|
| Power Management: | Enabled (see SUT Notes) |
| Operating System (OS): | Windows Server 2012 R2 Datacenter |
| OS Version: | Version 6.3 (Build 9600) |
| Filesystem: | NTFS |
| JVM Vendor: | Oracle Corporation |
| JVM Version: | Oracle Java HotSpot(TM) 64-Bit Server VM (build 24.80-b11, mixed mode), version 1.7.0_80 |
| JVM Command-line Options: | -server -Xmn21000m -Xms24000m -Xmx24000m -XX:SurvivorRatio=1 -XX:TargetSurvivorRatio=99 -XX:AllocatePrefetchDistance=256 -XX:AllocatePrefetchLines=4 -XX:LoopUnrollLimit=45 -XX:InitialTenuringThreshold=12 -XX:MaxTenuringThreshold=15 -XX:ParallelGCThreads=28 -XX:InlineSmallCode=3900 -XX:MaxInlineSize=270 -XX:FreqInlineSize=2500 -XX:+AggressiveOpts -XX:+UseLargePages -XX:+UseParallelOldGC |
| JVM Affinity: | start /NODE [0,1,2,3] /AFFINITY [0xFFFFFFF] |
| JVM Instances: | 4 |
| JVM Initial Heap (MB): | 24000 |
| JVM Maximum Heap (MB): | 24000 |
| JVM Address Bits: | 64 |
| Boot Firmware Version: | I42 v2.00 (02/02/2019) |
| Management Firmware Version: | 1.40 Feb 05 2019 |
| Workload Version: | SSJ 1.2.10 |
| Director Location: | Controller |
| Other Software: | HPE Service Pack for ProLiant (SPP) Version: 2019.03.0, Microsoft Windows KB4056898, KB4338815 |
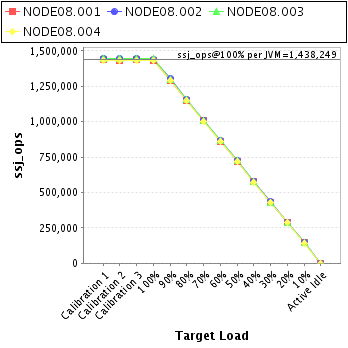
| JVM Instance | ssj_ops@100% |
|---|---|
| NODE08.001 | 1,433,621 |
| NODE08.002 | 1,442,492 |
| NODE08.003 | 1,445,866 |
| NODE08.004 | 1,431,019 |
| ssj_ops@100% | 5,752,998 |
| ssj_ops@100% per JVM | 1,438,249 |
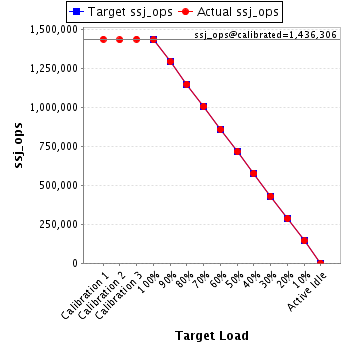
| Target Load | Actual Load | ssj_ops | |
|---|---|---|---|
| Target | Actual | ||
| Calibration 1 | 1,438,066 | ||
| Calibration 2 | 1,434,145 | ||
| Calibration 3 | 1,438,466 | ||
| ssj_ops@calibrated=1,436,306 | |||
| 100% | 99.8% | 1,436,306 | 1,433,621 |
| 90% | 90.1% | 1,292,675 | 1,294,591 |
| 80% | 80.0% | 1,149,044 | 1,149,310 |
| 70% | 70.1% | 1,005,414 | 1,007,512 |
| 60% | 59.8% | 861,783 | 859,587 |
| 50% | 49.9% | 718,153 | 716,705 |
| 40% | 40.1% | 574,522 | 576,582 |
| 30% | 30.0% | 430,892 | 431,420 |
| 20% | 20.0% | 287,261 | 287,544 |
| 10% | 10.1% | 143,631 | 144,826 |
| Active Idle | 0 | 0 | |
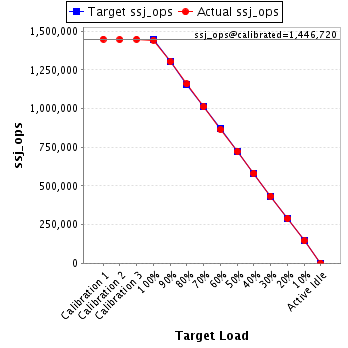
| Target Load | Actual Load | ssj_ops | |
|---|---|---|---|
| Target | Actual | ||
| Calibration 1 | 1,448,468 | ||
| Calibration 2 | 1,445,787 | ||
| Calibration 3 | 1,447,652 | ||
| ssj_ops@calibrated=1,446,720 | |||
| 100% | 99.7% | 1,446,720 | 1,442,492 |
| 90% | 90.1% | 1,302,048 | 1,303,153 |
| 80% | 80.1% | 1,157,376 | 1,159,022 |
| 70% | 69.9% | 1,012,704 | 1,011,426 |
| 60% | 59.7% | 868,032 | 864,289 |
| 50% | 49.9% | 723,360 | 722,616 |
| 40% | 40.1% | 578,688 | 579,983 |
| 30% | 30.0% | 434,016 | 434,419 |
| 20% | 20.0% | 289,344 | 289,068 |
| 10% | 10.1% | 144,672 | 145,745 |
| Active Idle | 0 | 0 | |
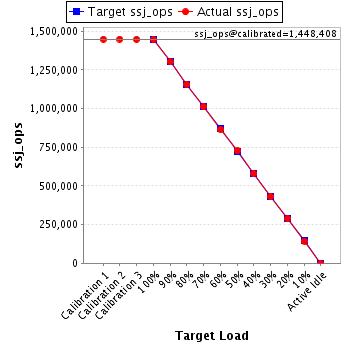
| Target Load | Actual Load | ssj_ops | |
|---|---|---|---|
| Target | Actual | ||
| Calibration 1 | 1,448,462 | ||
| Calibration 2 | 1,449,118 | ||
| Calibration 3 | 1,447,698 | ||
| ssj_ops@calibrated=1,448,408 | |||
| 100% | 99.8% | 1,448,408 | 1,445,866 |
| 90% | 89.9% | 1,303,567 | 1,301,510 |
| 80% | 79.9% | 1,158,726 | 1,157,846 |
| 70% | 69.9% | 1,013,886 | 1,011,991 |
| 60% | 59.8% | 869,045 | 865,468 |
| 50% | 50.2% | 724,204 | 726,971 |
| 40% | 40.0% | 579,363 | 578,665 |
| 30% | 29.9% | 434,522 | 432,867 |
| 20% | 19.9% | 289,682 | 288,223 |
| 10% | 9.9% | 144,841 | 143,708 |
| Active Idle | 0 | 0 | |
| Target Load | Actual Load | ssj_ops | |
|---|---|---|---|
| Target | Actual | ||
| Calibration 1 | 1,436,136 | ||
| Calibration 2 | 1,435,303 | ||
| Calibration 3 | 1,434,897 | ||
| ssj_ops@calibrated=1,435,100 | |||
| 100% | 99.7% | 1,435,100 | 1,431,019 |
| 90% | 90.0% | 1,291,590 | 1,291,377 |
| 80% | 79.9% | 1,148,080 | 1,147,297 |
| 70% | 69.9% | 1,004,570 | 1,003,299 |
| 60% | 60.1% | 861,060 | 862,484 |
| 50% | 50.0% | 717,550 | 718,122 |
| 40% | 40.0% | 574,040 | 574,191 |
| 30% | 30.0% | 430,530 | 430,475 |
| 20% | 20.1% | 287,020 | 288,239 |
| 10% | 10.0% | 143,510 | 143,110 |
| Active Idle | 0 | 0 | |
