SPECpower_ssj2008
Host 'NODE05' Performance Report
Copyright © 2007-2019 Standard Performance Evaluation Corporation
| Hewlett Packard Enterprise Synergy 480 Gen10 Compute Module | ssj_ops@100% = 5,745,922 ssj_ops@100% per JVM = 1,436,480 |
||||
| Test Sponsor: | Hewlett Packard Enterprise | SPEC License #: | 3 | Test Method: | Multi Node |
| Tested By: | Hewlett Packard Enterprise | Test Location: | Houston, TX, USA | Test Date: | Apr 8, 2019 |
| Hardware Availability: | Apr-2019 | Software Availability: | Mar-2019 | Publication: | May 8, 2019 |
| System Source: | Single Supplier | System Designation: | Server | Power Provisioning: | Line-powered |
| Target Load | Actual Load | ssj_ops | |
|---|---|---|---|
| Target | Actual | ||
| Calibration 1 | 5,773,637 | ||
| Calibration 2 | 5,770,422 | ||
| Calibration 3 | 5,766,856 | ||
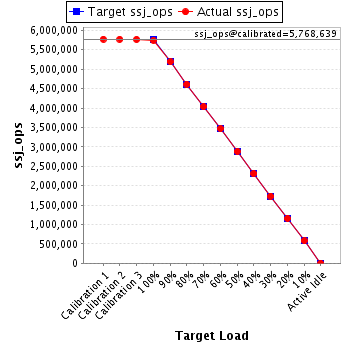
| ssj_ops@calibrated=5,768,639 | |||
| 100% | 99.6% | 5,768,639 | 5,745,922 |
| 90% | 90.0% | 5,191,775 | 5,191,767 |
| 80% | 79.9% | 4,614,911 | 4,611,820 |
| 70% | 70.0% | 4,038,047 | 4,036,429 |
| 60% | 60.1% | 3,461,183 | 3,467,090 |
| 50% | 50.0% | 2,884,319 | 2,882,719 |
| 40% | 40.0% | 2,307,456 | 2,306,233 |
| 30% | 30.0% | 1,730,592 | 1,731,894 |
| 20% | 20.1% | 1,153,728 | 1,157,047 |
| 10% | 10.0% | 576,864 | 578,650 |
| Active Idle | 0 | 0 | |
| Set Identifier: | SUT |
| Set Description: | System Under Test |
| # of Identical Nodes: | 12 |
| Comment: | SUT |
| Hardware | |
|---|---|
| Hardware Vendor: | Hewlett Packard Enterprise |
| Model: | Synergy 480 Gen10 Compute Module |
| Form Factor: | 7U |
| CPU Name: | Intel Xeon Platinum 8280 @ 2.70GHz (Intel Turbo Boost Technology up to 4.00 GHz) |
| CPU Characteristics: | 28-Core, 2.70 GHz, 38.5MB L3 Cache |
| CPU Frequency (MHz): | 2700 |
| CPU(s) Enabled: | 56 cores, 2 chips, 28 cores/chip |
| Hardware Threads: | 112 (2 / core) |
| CPU(s) Orderable: | 1,2 chips |
| Primary Cache: | 32 KB I + 32 KB D on chip per core |
| Secondary Cache: | 1 MB I+D on chip per core |
| Tertiary Cache: | 39424 KB I+D on chip per chip |
| Other Cache: | None |
| Memory Amount (GB): | 192 |
| # and size of DIMM: | 12 x 16384 MB |
| Memory Details: | 12 x 16GB 2Rx8 PC4-2933Y-R; slots 1, 3, 5, 8, 10 and 12 populated in each socket |
| Power Supply Quantity and Rating (W): | None |
| Power Supply Details: | N/A |
| Disk Drive: | 1 x HPE 240GB 6G SATA M.2 SSD (875488-B21) |
| Disk Controller: | HPE Smart Array S100i SR Gen10 |
| # and type of Network Interface Cards (NICs) Installed: | 1 x HPE Synergy 3820C 10/20Gb CNA |
| NICs Enabled in Firmware / OS / Connected: | 2/2/1 |
| Network Speed (Mbit): | 1000 |
| Keyboard: | None |
| Mouse: | None |
| Monitor: | None |
| Optical Drives: | No |
| Other Hardware: | H/S: Standard |
| Software | |
|---|---|
| Power Management: | Enabled (see SUT Notes) |
| Operating System (OS): | Windows Server 2012 R2 Datacenter |
| OS Version: | Version 6.3 (Build 9600) |
| Filesystem: | NTFS |
| JVM Vendor: | Oracle Corporation |
| JVM Version: | Oracle Java HotSpot(TM) 64-Bit Server VM (build 24.80-b11, mixed mode), version 1.7.0_80 |
| JVM Command-line Options: | -server -Xmn19000m -Xms21000m -Xmx21000m -XX:SurvivorRatio=1 -XX:TargetSurvivorRatio=99 -XX:AllocatePrefetchDistance=256 -XX:AllocatePrefetchLines=4 -XX:LoopUnrollLimit=45 -XX:InitialTenuringThreshold=12 -XX:MaxTenuringThreshold=15 -XX:ParallelGCThreads=28 -XX:InlineSmallCode=3900 -XX:MaxInlineSize=270 -XX:FreqInlineSize=2500 -XX:+AggressiveOpts -XX:+UseLargePages -XX:+UseParallelOldGC |
| JVM Affinity: | start /NODE [0,1,2,3] /AFFINITY [0xFFFFFFF] |
| JVM Instances: | 4 |
| JVM Initial Heap (MB): | 21000 |
| JVM Maximum Heap (MB): | 21000 |
| JVM Address Bits: | 64 |
| Boot Firmware Version: | I42 v2.00 (02/02/2019) |
| Management Firmware Version: | 1.40 Feb 05 2019 |
| Workload Version: | SSJ 1.2.10 |
| Director Location: | Controller |
| Other Software: | HPE Service Pack for ProLiant (SPP) Version: 2019.03.0, Microsoft Windows KB4056898, KB4338815 |
| JVM Instance | ssj_ops@100% |
|---|---|
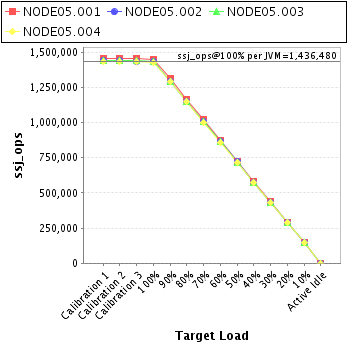
| NODE05.001 | 1,448,479 |
| NODE05.002 | 1,435,032 |
| NODE05.003 | 1,433,264 |
| NODE05.004 | 1,429,147 |
| ssj_ops@100% | 5,745,922 |
| ssj_ops@100% per JVM | 1,436,480 |
| Target Load | Actual Load | ssj_ops | |
|---|---|---|---|
| Target | Actual | ||
| Calibration 1 | 1,456,068 | ||
| Calibration 2 | 1,458,066 | ||
| Calibration 3 | 1,453,327 | ||
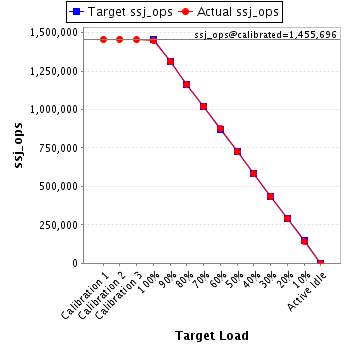
| ssj_ops@calibrated=1,455,696 | |||
| 100% | 99.5% | 1,455,696 | 1,448,479 |
| 90% | 90.1% | 1,310,126 | 1,312,238 |
| 80% | 79.9% | 1,164,557 | 1,163,225 |
| 70% | 70.0% | 1,018,987 | 1,019,597 |
| 60% | 60.1% | 873,418 | 874,583 |
| 50% | 49.9% | 727,848 | 726,439 |
| 40% | 40.0% | 582,278 | 581,806 |
| 30% | 30.0% | 436,709 | 436,796 |
| 20% | 20.1% | 291,139 | 291,873 |
| 10% | 9.9% | 145,570 | 144,674 |
| Active Idle | 0 | 0 | |
| Target Load | Actual Load | ssj_ops | |
|---|---|---|---|
| Target | Actual | ||
| Calibration 1 | 1,443,294 | ||
| Calibration 2 | 1,438,452 | ||
| Calibration 3 | 1,437,065 | ||
| ssj_ops@calibrated=1,437,759 | |||
| 100% | 99.8% | 1,437,759 | 1,435,032 |
| 90% | 90.1% | 1,293,983 | 1,295,136 |
| 80% | 79.8% | 1,150,207 | 1,147,085 |
| 70% | 70.1% | 1,006,431 | 1,008,248 |
| 60% | 60.2% | 862,655 | 866,010 |
| 50% | 50.1% | 718,879 | 720,657 |
| 40% | 39.8% | 575,103 | 572,609 |
| 30% | 30.1% | 431,328 | 432,731 |
| 20% | 20.0% | 287,552 | 287,132 |
| 10% | 10.0% | 143,776 | 144,162 |
| Active Idle | 0 | 0 | |

| Target Load | Actual Load | ssj_ops | |
|---|---|---|---|
| Target | Actual | ||
| Calibration 1 | 1,440,011 | ||
| Calibration 2 | 1,440,206 | ||
| Calibration 3 | 1,441,911 | ||
| ssj_ops@calibrated=1,441,058 | |||
| 100% | 99.5% | 1,441,058 | 1,433,264 |
| 90% | 89.8% | 1,296,953 | 1,294,776 |
| 80% | 80.0% | 1,152,847 | 1,153,289 |
| 70% | 70.0% | 1,008,741 | 1,008,879 |
| 60% | 60.1% | 864,635 | 865,566 |
| 50% | 49.7% | 720,529 | 716,695 |
| 40% | 40.1% | 576,423 | 577,206 |
| 30% | 30.1% | 432,318 | 433,551 |
| 20% | 20.1% | 288,212 | 289,490 |
| 10% | 10.1% | 144,106 | 144,895 |
| Active Idle | 0 | 0 | |

| Target Load | Actual Load | ssj_ops | |
|---|---|---|---|
| Target | Actual | ||
| Calibration 1 | 1,434,263 | ||
| Calibration 2 | 1,433,698 | ||
| Calibration 3 | 1,434,553 | ||
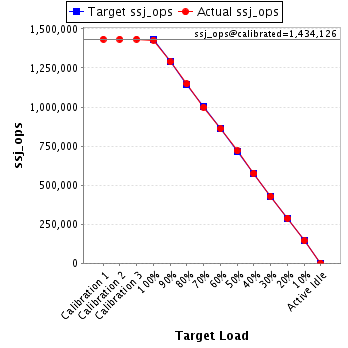
| ssj_ops@calibrated=1,434,126 | |||
| 100% | 99.7% | 1,434,126 | 1,429,147 |
| 90% | 89.9% | 1,290,713 | 1,289,618 |
| 80% | 80.1% | 1,147,301 | 1,148,220 |
| 70% | 69.7% | 1,003,888 | 999,704 |
| 60% | 60.0% | 860,476 | 860,931 |
| 50% | 50.1% | 717,063 | 718,927 |
| 40% | 40.1% | 573,650 | 574,611 |
| 30% | 29.9% | 430,238 | 428,816 |
| 20% | 20.1% | 286,825 | 288,553 |
| 10% | 10.1% | 143,413 | 144,919 |
| Active Idle | 0 | 0 | |