SPECpower_ssj2008
Host 'NODE06' Performance Report
Copyright © 2007-2019 Standard Performance Evaluation Corporation
| Hewlett Packard Enterprise Synergy 480 Gen10 Compute Module | ssj_ops@100% = 5,782,860 ssj_ops@100% per JVM = 1,445,715 |
||||
| Test Sponsor: | Hewlett Packard Enterprise | SPEC License #: | 3 | Test Method: | Multi Node |
| Tested By: | Hewlett Packard Enterprise | Test Location: | Houston, TX, USA | Test Date: | Apr 8, 2019 |
| Hardware Availability: | Apr-2019 | Software Availability: | Mar-2019 | Publication: | May 8, 2019 |
| System Source: | Single Supplier | System Designation: | Server | Power Provisioning: | Line-powered |
| Target Load | Actual Load | ssj_ops | |
|---|---|---|---|
| Target | Actual | ||
| Calibration 1 | 5,804,108 | ||
| Calibration 2 | 5,807,573 | ||
| Calibration 3 | 5,803,827 | ||
| ssj_ops@calibrated=5,805,700 | |||
| 100% | 99.6% | 5,805,700 | 5,782,860 |
| 90% | 89.9% | 5,225,130 | 5,222,155 |
| 80% | 80.0% | 4,644,560 | 4,643,332 |
| 70% | 70.0% | 4,063,990 | 4,063,428 |
| 60% | 60.0% | 3,483,420 | 3,483,074 |
| 50% | 50.1% | 2,902,850 | 2,907,122 |
| 40% | 40.1% | 2,322,280 | 2,326,758 |
| 30% | 30.0% | 1,741,710 | 1,740,469 |
| 20% | 20.0% | 1,161,140 | 1,161,080 |
| 10% | 10.0% | 580,570 | 579,034 |
| Active Idle | 0 | 0 | |

| Set Identifier: | SUT |
| Set Description: | System Under Test |
| # of Identical Nodes: | 12 |
| Comment: | SUT |
| Hardware | |
|---|---|
| Hardware Vendor: | Hewlett Packard Enterprise |
| Model: | Synergy 480 Gen10 Compute Module |
| Form Factor: | 7U |
| CPU Name: | Intel Xeon Platinum 8280 @ 2.70GHz (Intel Turbo Boost Technology up to 4.00 GHz) |
| CPU Characteristics: | 28-Core, 2.70 GHz, 38.5MB L3 Cache |
| CPU Frequency (MHz): | 2700 |
| CPU(s) Enabled: | 56 cores, 2 chips, 28 cores/chip |
| Hardware Threads: | 112 (2 / core) |
| CPU(s) Orderable: | 1,2 chips |
| Primary Cache: | 32 KB I + 32 KB D on chip per core |
| Secondary Cache: | 1 MB I+D on chip per core |
| Tertiary Cache: | 39424 KB I+D on chip per chip |
| Other Cache: | None |
| Memory Amount (GB): | 192 |
| # and size of DIMM: | 12 x 16384 MB |
| Memory Details: | 12 x 16GB 2Rx8 PC4-2933Y-R; slots 1, 3, 5, 8, 10 and 12 populated in each socket |
| Power Supply Quantity and Rating (W): | None |
| Power Supply Details: | N/A |
| Disk Drive: | 1 x HPE 240GB 6G SATA M.2 SSD (875488-B21) |
| Disk Controller: | HPE Smart Array S100i SR Gen10 |
| # and type of Network Interface Cards (NICs) Installed: | 1 x HPE Synergy 3820C 10/20Gb CNA |
| NICs Enabled in Firmware / OS / Connected: | 2/2/1 |
| Network Speed (Mbit): | 1000 |
| Keyboard: | None |
| Mouse: | None |
| Monitor: | None |
| Optical Drives: | No |
| Other Hardware: | H/S: Standard |
| Software | |
|---|---|
| Power Management: | Enabled (see SUT Notes) |
| Operating System (OS): | Windows Server 2012 R2 Datacenter |
| OS Version: | Version 6.3 (Build 9600) |
| Filesystem: | NTFS |
| JVM Vendor: | Oracle Corporation |
| JVM Version: | Oracle Java HotSpot(TM) 64-Bit Server VM (build 24.80-b11, mixed mode), version 1.7.0_80 |
| JVM Command-line Options: | -server -Xmn19000m -Xms21000m -Xmx21000m -XX:SurvivorRatio=1 -XX:TargetSurvivorRatio=99 -XX:AllocatePrefetchDistance=256 -XX:AllocatePrefetchLines=4 -XX:LoopUnrollLimit=45 -XX:InitialTenuringThreshold=12 -XX:MaxTenuringThreshold=15 -XX:ParallelGCThreads=28 -XX:InlineSmallCode=3900 -XX:MaxInlineSize=270 -XX:FreqInlineSize=2500 -XX:+AggressiveOpts -XX:+UseLargePages -XX:+UseParallelOldGC |
| JVM Affinity: | start /NODE [0,1,2,3] /AFFINITY [0xFFFFFFF] |
| JVM Instances: | 4 |
| JVM Initial Heap (MB): | 21000 |
| JVM Maximum Heap (MB): | 21000 |
| JVM Address Bits: | 64 |
| Boot Firmware Version: | I42 v2.00 (02/02/2019) |
| Management Firmware Version: | 1.40 Feb 05 2019 |
| Workload Version: | SSJ 1.2.10 |
| Director Location: | Controller |
| Other Software: | HPE Service Pack for ProLiant (SPP) Version: 2019.03.0, Microsoft Windows KB4056898, KB4338815 |
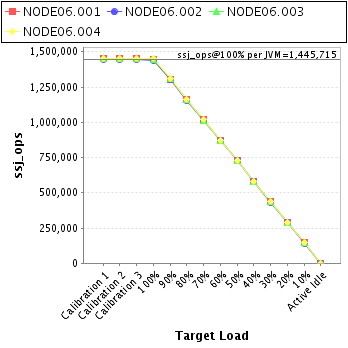
| JVM Instance | ssj_ops@100% |
|---|---|
| NODE06.001 | 1,446,627 |
| NODE06.002 | 1,437,840 |
| NODE06.003 | 1,447,470 |
| NODE06.004 | 1,450,922 |
| ssj_ops@100% | 5,782,860 |
| ssj_ops@100% per JVM | 1,445,715 |
| Target Load | Actual Load | ssj_ops | |
|---|---|---|---|
| Target | Actual | ||
| Calibration 1 | 1,450,416 | ||
| Calibration 2 | 1,451,225 | ||
| Calibration 3 | 1,452,266 | ||
| ssj_ops@calibrated=1,451,745 | |||
| 100% | 99.6% | 1,451,745 | 1,446,627 |
| 90% | 89.8% | 1,306,571 | 1,304,110 |
| 80% | 80.1% | 1,161,396 | 1,162,450 |
| 70% | 70.0% | 1,016,222 | 1,016,560 |
| 60% | 59.8% | 871,047 | 867,444 |
| 50% | 50.0% | 725,873 | 726,134 |
| 40% | 40.1% | 580,698 | 582,199 |
| 30% | 30.1% | 435,524 | 437,181 |
| 20% | 20.0% | 290,349 | 290,222 |
| 10% | 10.0% | 145,175 | 145,534 |
| Active Idle | 0 | 0 | |
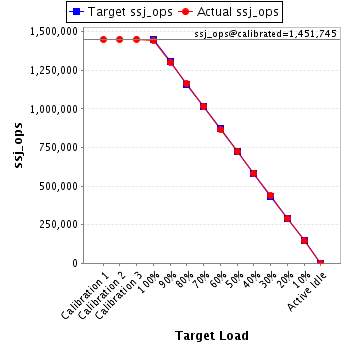
| Target Load | Actual Load | ssj_ops | |
|---|---|---|---|
| Target | Actual | ||
| Calibration 1 | 1,448,282 | ||
| Calibration 2 | 1,448,257 | ||
| Calibration 3 | 1,446,706 | ||
| ssj_ops@calibrated=1,447,482 | |||
| 100% | 99.3% | 1,447,482 | 1,437,840 |
| 90% | 89.9% | 1,302,733 | 1,301,925 |
| 80% | 79.8% | 1,157,985 | 1,154,751 |
| 70% | 70.1% | 1,013,237 | 1,014,450 |
| 60% | 60.1% | 868,489 | 869,822 |
| 50% | 50.1% | 723,741 | 725,369 |
| 40% | 40.0% | 578,993 | 579,224 |
| 30% | 29.9% | 434,244 | 432,305 |
| 20% | 20.0% | 289,496 | 289,789 |
| 10% | 9.9% | 144,748 | 143,420 |
| Active Idle | 0 | 0 | |
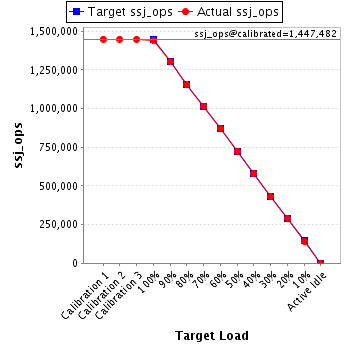
| Target Load | Actual Load | ssj_ops | |
|---|---|---|---|
| Target | Actual | ||
| Calibration 1 | 1,452,036 | ||
| Calibration 2 | 1,453,464 | ||
| Calibration 3 | 1,452,153 | ||
| ssj_ops@calibrated=1,452,808 | |||
| 100% | 99.6% | 1,452,808 | 1,447,470 |
| 90% | 90.0% | 1,307,527 | 1,307,881 |
| 80% | 80.1% | 1,162,247 | 1,163,583 |
| 70% | 69.8% | 1,016,966 | 1,014,232 |
| 60% | 60.1% | 871,685 | 872,786 |
| 50% | 50.0% | 726,404 | 726,461 |
| 40% | 40.1% | 581,123 | 583,207 |
| 30% | 30.0% | 435,842 | 435,459 |
| 20% | 20.0% | 290,562 | 289,902 |
| 10% | 9.9% | 145,281 | 144,529 |
| Active Idle | 0 | 0 | |

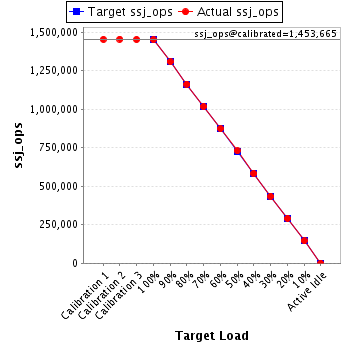
| Target Load | Actual Load | ssj_ops | |
|---|---|---|---|
| Target | Actual | ||
| Calibration 1 | 1,453,374 | ||
| Calibration 2 | 1,454,627 | ||
| Calibration 3 | 1,452,703 | ||
| ssj_ops@calibrated=1,453,665 | |||
| 100% | 99.8% | 1,453,665 | 1,450,922 |
| 90% | 90.0% | 1,308,299 | 1,308,239 |
| 80% | 80.0% | 1,162,932 | 1,162,548 |
| 70% | 70.0% | 1,017,566 | 1,018,186 |
| 60% | 60.1% | 872,199 | 873,022 |
| 50% | 50.2% | 726,833 | 729,159 |
| 40% | 40.0% | 581,466 | 582,127 |
| 30% | 30.0% | 436,100 | 435,525 |
| 20% | 20.0% | 290,733 | 291,166 |
| 10% | 10.0% | 145,367 | 145,551 |
| Active Idle | 0 | 0 | |