
SPECpower_ssj2008
Host 'NODE10' Performance Report
Copyright © 2007-2019 Standard Performance Evaluation Corporation
| Hewlett Packard Enterprise Synergy 480 Gen10 Compute Module | ssj_ops@100% = 5,744,486 ssj_ops@100% per JVM = 1,436,122 |
||||
| Test Sponsor: | Hewlett Packard Enterprise | SPEC License #: | 3 | Test Method: | Multi Node |
| Tested By: | Hewlett Packard Enterprise | Test Location: | Houston, TX, USA | Test Date: | Apr 8, 2019 |
| Hardware Availability: | Apr-2019 | Software Availability: | Mar-2019 | Publication: | May 8, 2019 |
| System Source: | Single Supplier | System Designation: | Server | Power Provisioning: | Line-powered |
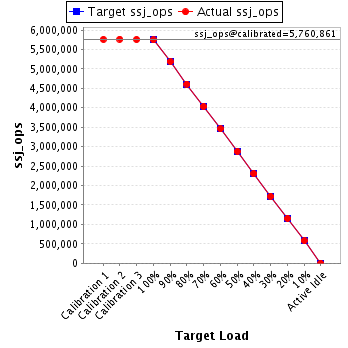
| Target Load | Actual Load | ssj_ops | |
|---|---|---|---|
| Target | Actual | ||
| Calibration 1 | 5,758,343 | ||
| Calibration 2 | 5,764,383 | ||
| Calibration 3 | 5,757,339 | ||
| ssj_ops@calibrated=5,760,861 | |||
| 100% | 99.7% | 5,760,861 | 5,744,486 |
| 90% | 90.0% | 5,184,775 | 5,186,754 |
| 80% | 80.0% | 4,608,689 | 4,609,767 |
| 70% | 70.0% | 4,032,603 | 4,034,763 |
| 60% | 60.0% | 3,456,517 | 3,455,244 |
| 50% | 50.0% | 2,880,431 | 2,878,237 |
| 40% | 40.0% | 2,304,344 | 2,302,573 |
| 30% | 29.9% | 1,728,258 | 1,723,274 |
| 20% | 20.0% | 1,152,172 | 1,154,631 |
| 10% | 10.0% | 576,086 | 577,681 |
| Active Idle | 0 | 0 | |
| Set Identifier: | SUT |
| Set Description: | System Under Test |
| # of Identical Nodes: | 12 |
| Comment: | SUT |
| Hardware | |
|---|---|
| Hardware Vendor: | Hewlett Packard Enterprise |
| Model: | Synergy 480 Gen10 Compute Module |
| Form Factor: | 7U |
| CPU Name: | Intel Xeon Platinum 8280 @ 2.70GHz (Intel Turbo Boost Technology up to 4.00 GHz) |
| CPU Characteristics: | 28-Core, 2.70 GHz, 38.5MB L3 Cache |
| CPU Frequency (MHz): | 2700 |
| CPU(s) Enabled: | 56 cores, 2 chips, 28 cores/chip |
| Hardware Threads: | 112 (2 / core) |
| CPU(s) Orderable: | 1,2 chips |
| Primary Cache: | 32 KB I + 32 KB D on chip per core |
| Secondary Cache: | 1 MB I+D on chip per core |
| Tertiary Cache: | 39424 KB I+D on chip per chip |
| Other Cache: | None |
| Memory Amount (GB): | 192 |
| # and size of DIMM: | 12 x 16384 MB |
| Memory Details: | 12 x 16GB 2Rx8 PC4-2933Y-R; slots 1, 3, 5, 8, 10 and 12 populated in each socket |
| Power Supply Quantity and Rating (W): | None |
| Power Supply Details: | N/A |
| Disk Drive: | 1 x HPE 240GB 6G SATA M.2 SSD (875488-B21) |
| Disk Controller: | HPE Smart Array S100i SR Gen10 |
| # and type of Network Interface Cards (NICs) Installed: | 1 x HPE Synergy 3820C 10/20Gb CNA |
| NICs Enabled in Firmware / OS / Connected: | 2/2/1 |
| Network Speed (Mbit): | 1000 |
| Keyboard: | None |
| Mouse: | None |
| Monitor: | None |
| Optical Drives: | No |
| Other Hardware: | H/S: Standard |
| Software | |
|---|---|
| Power Management: | Enabled (see SUT Notes) |
| Operating System (OS): | Windows Server 2012 R2 Datacenter |
| OS Version: | Version 6.3 (Build 9600) |
| Filesystem: | NTFS |
| JVM Vendor: | Oracle Corporation |
| JVM Version: | Oracle Java HotSpot(TM) 64-Bit Server VM (build 24.80-b11, mixed mode), version 1.7.0_80 |
| JVM Command-line Options: | -server -Xmn19000m -Xms21000m -Xmx21000m -XX:SurvivorRatio=1 -XX:TargetSurvivorRatio=99 -XX:AllocatePrefetchDistance=256 -XX:AllocatePrefetchLines=4 -XX:LoopUnrollLimit=45 -XX:InitialTenuringThreshold=12 -XX:MaxTenuringThreshold=15 -XX:ParallelGCThreads=28 -XX:InlineSmallCode=3900 -XX:MaxInlineSize=270 -XX:FreqInlineSize=2500 -XX:+AggressiveOpts -XX:+UseLargePages -XX:+UseParallelOldGC |
| JVM Affinity: | start /NODE [0,1,2,3] /AFFINITY [0xFFFFFFF] |
| JVM Instances: | 4 |
| JVM Initial Heap (MB): | 21000 |
| JVM Maximum Heap (MB): | 21000 |
| JVM Address Bits: | 64 |
| Boot Firmware Version: | I42 v2.00 (02/02/2019) |
| Management Firmware Version: | 1.40 Feb 05 2019 |
| Workload Version: | SSJ 1.2.10 |
| Director Location: | Controller |
| Other Software: | HPE Service Pack for ProLiant (SPP) Version: 2019.03.0, Microsoft Windows KB4056898, KB4338815 |
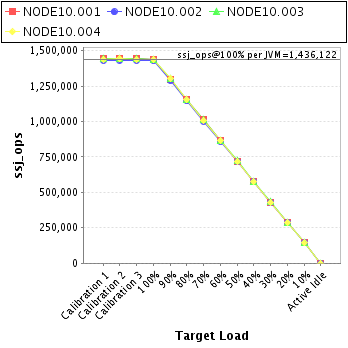
| JVM Instance | ssj_ops@100% |
|---|---|
| NODE10.001 | 1,439,809 |
| NODE10.002 | 1,427,807 |
| NODE10.003 | 1,439,651 |
| NODE10.004 | 1,437,219 |
| ssj_ops@100% | 5,744,486 |
| ssj_ops@100% per JVM | 1,436,122 |
| Target Load | Actual Load | ssj_ops | |
|---|---|---|---|
| Target | Actual | ||
| Calibration 1 | 1,443,130 | ||
| Calibration 2 | 1,443,727 | ||
| Calibration 3 | 1,442,340 | ||
| ssj_ops@calibrated=1,443,034 | |||
| 100% | 99.8% | 1,443,034 | 1,439,809 |
| 90% | 89.8% | 1,298,730 | 1,295,816 |
| 80% | 80.2% | 1,154,427 | 1,157,506 |
| 70% | 70.1% | 1,010,124 | 1,011,752 |
| 60% | 60.0% | 865,820 | 865,242 |
| 50% | 49.9% | 721,517 | 720,477 |
| 40% | 40.0% | 577,213 | 576,561 |
| 30% | 29.9% | 432,910 | 431,522 |
| 20% | 20.1% | 288,607 | 289,478 |
| 10% | 10.0% | 144,303 | 144,633 |
| Active Idle | 0 | 0 | |

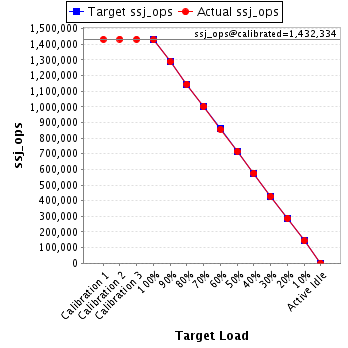
| Target Load | Actual Load | ssj_ops | |
|---|---|---|---|
| Target | Actual | ||
| Calibration 1 | 1,431,157 | ||
| Calibration 2 | 1,432,693 | ||
| Calibration 3 | 1,431,975 | ||
| ssj_ops@calibrated=1,432,334 | |||
| 100% | 99.7% | 1,432,334 | 1,427,807 |
| 90% | 89.9% | 1,289,101 | 1,288,144 |
| 80% | 79.9% | 1,145,867 | 1,144,622 |
| 70% | 70.0% | 1,002,634 | 1,002,638 |
| 60% | 59.8% | 859,400 | 856,808 |
| 50% | 50.0% | 716,167 | 715,531 |
| 40% | 40.2% | 572,934 | 575,382 |
| 30% | 29.8% | 429,700 | 427,340 |
| 20% | 20.1% | 286,467 | 287,396 |
| 10% | 10.1% | 143,233 | 144,008 |
| Active Idle | 0 | 0 | |
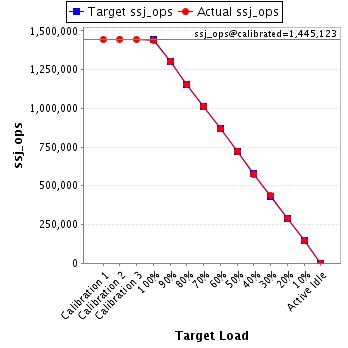
| Target Load | Actual Load | ssj_ops | |
|---|---|---|---|
| Target | Actual | ||
| Calibration 1 | 1,443,884 | ||
| Calibration 2 | 1,446,426 | ||
| Calibration 3 | 1,443,820 | ||
| ssj_ops@calibrated=1,445,123 | |||
| 100% | 99.6% | 1,445,123 | 1,439,651 |
| 90% | 90.0% | 1,300,611 | 1,300,886 |
| 80% | 79.9% | 1,156,098 | 1,154,595 |
| 70% | 70.1% | 1,011,586 | 1,012,847 |
| 60% | 60.0% | 867,074 | 866,826 |
| 50% | 50.1% | 722,561 | 724,280 |
| 40% | 39.8% | 578,049 | 575,415 |
| 30% | 30.1% | 433,537 | 434,585 |
| 20% | 20.1% | 289,025 | 290,299 |
| 10% | 10.0% | 144,512 | 145,197 |
| Active Idle | 0 | 0 | |
| Target Load | Actual Load | ssj_ops | |
|---|---|---|---|
| Target | Actual | ||
| Calibration 1 | 1,440,171 | ||
| Calibration 2 | 1,441,536 | ||
| Calibration 3 | 1,439,205 | ||
| ssj_ops@calibrated=1,440,370 | |||
| 100% | 99.8% | 1,440,370 | 1,437,219 |
| 90% | 90.4% | 1,296,333 | 1,301,908 |
| 80% | 80.1% | 1,152,296 | 1,153,044 |
| 70% | 69.9% | 1,008,259 | 1,007,525 |
| 60% | 60.1% | 864,222 | 866,367 |
| 50% | 49.8% | 720,185 | 717,949 |
| 40% | 39.9% | 576,148 | 575,215 |
| 30% | 29.8% | 432,111 | 429,827 |
| 20% | 20.0% | 288,074 | 287,459 |
| 10% | 10.0% | 144,037 | 143,843 |
| Active Idle | 0 | 0 | |
