
SPECpower_ssj2008
Host 'WIN-SUT104' Performance Report
Copyright © 2007-2019 Standard Performance Evaluation Corporation
| New H3C Technologies Co., Ltd. H3C UniServer B5700 G3 | ssj_ops@100% = 5,666,277 ssj_ops@100% per JVM = 1,416,569 |
||||
| Test Sponsor: | New H3C Technologies Co., Ltd. | SPEC License #: | 9066 | Test Method: | Multi Node |
| Tested By: | New H3C Technologies Co., Ltd. | Test Location: | Hangzhou, Zhejiang, China | Test Date: | May 15, 2019 |
| Hardware Availability: | Jan-2019 | Software Availability: | Jan-2019 | Publication: | Jun 12, 2019 |
| System Source: | Single Supplier | System Designation: | Server | Power Provisioning: | Line-powered |
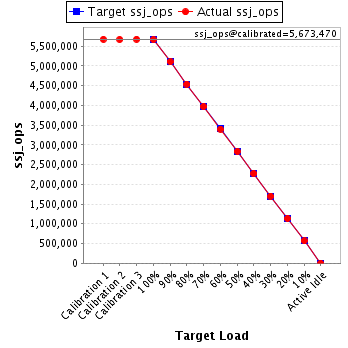
| Target Load | Actual Load | ssj_ops | |
|---|---|---|---|
| Target | Actual | ||
| Calibration 1 | 5,676,382 | ||
| Calibration 2 | 5,668,741 | ||
| Calibration 3 | 5,678,200 | ||
| ssj_ops@calibrated=5,673,470 | |||
| 100% | 99.9% | 5,673,470 | 5,666,277 |
| 90% | 90.0% | 5,106,123 | 5,106,134 |
| 80% | 80.0% | 4,538,776 | 4,538,030 |
| 70% | 70.0% | 3,971,429 | 3,974,121 |
| 60% | 59.9% | 3,404,082 | 3,400,580 |
| 50% | 49.9% | 2,836,735 | 2,833,736 |
| 40% | 40.0% | 2,269,388 | 2,271,066 |
| 30% | 30.0% | 1,702,041 | 1,704,188 |
| 20% | 20.0% | 1,134,694 | 1,135,243 |
| 10% | 10.0% | 567,347 | 566,659 |
| Active Idle | 0 | 0 | |
| Set Identifier: | sut |
| Set Description: | System Under Test |
| # of Identical Nodes: | 10 |
| Comment: | SUT |
| Hardware | |
|---|---|
| Hardware Vendor: | New H3C Technologies Co., Ltd. |
| Model: | H3C UniServer B5700 G3 |
| Form Factor: | Other |
| CPU Name: | Intel Xeon Platinum 8180 2.50GHz |
| CPU Characteristics: | 28-Core, 2.50 GHz, 38.5 MB L3 Cache |
| CPU Frequency (MHz): | 2500 |
| CPU(s) Enabled: | 56 cores, 2 chips, 28 cores/chip |
| Hardware Threads: | 112 (2 / core) |
| CPU(s) Orderable: | 1,2 chips |
| Primary Cache: | 32 KB I + 32 KB D on chip per core |
| Secondary Cache: | 1 MB I+D on chip per core |
| Tertiary Cache: | 39424 KB I+D on chip per chip |
| Other Cache: | None |
| Memory Amount (GB): | 192.0 |
| # and size of DIMM: | 12 x 16384 MB |
| Memory Details: | 12 x 16GB 2Rx8 PC4-2666-V ECC;slots A1, A2, A3, A4, A5, A6, B1, B2, B3, B4, B5, B6 populated |
| Power Supply Quantity and Rating (W): | None |
| Power Supply Details: | Shared |
| Disk Drive: | SATA DOM 128GB P/N DESSH-A28D09BCADCA |
| Disk Controller: | Integrated SATA controller |
| # and type of Network Interface Cards (NICs) Installed: | 1 x Intel I350 Gigabit Ethernet Controller |
| NICs Enabled in Firmware / OS / Connected: | 2/2/1 |
| Network Speed (Mbit): | 1000 |
| Keyboard: | None |
| Mouse: | None |
| Monitor: | None |
| Optical Drives: | No |
| Other Hardware: | None |
| Software | |
|---|---|
| Power Management: | Balanced Mode enabled in OS (see SUT Notes) |
| Operating System (OS): | Microsoft Windows Server 2012 R2 Datacenter |
| OS Version: | Version 6.3 (Build 9600) |
| Filesystem: | NTFS |
| JVM Vendor: | Oracle Corporation |
| JVM Version: | Java HotSpot(TM) 64-Bit Server VM (build 24.80-b11, mixed mode), version 1.7.0_80 |
| JVM Command-line Options: | -server -Xmn19g -Xms21g -Xmx21g -XX:SurvivorRatio=1 -XX:TargetSurvivorRatio=99 -XX:ParallelGCThreads=28 -XX:AllocatePrefetchDistance=256 -XX:AllocatePrefetchLines=4 -XX:LoopUnrollLimit=45 -XX:InitialTenuringThreshold=12 -XX:MaxTenuringThreshold=15 -XX:InlineSmallCode=9000 -XX:MaxInlineSize=270 -XX:FreqInlineSize=6000 -XX:+UseLargePages -XX:+UseParallelOldGC -XX:+AggressiveOpts |
| JVM Affinity: | start /NODE [0,2] /AFFINITY [0xFC0FF00FC0FF];start /NODE [1,3] /AFFINITY [0xFF03F00FF03F] |
| JVM Instances: | 4 |
| JVM Initial Heap (MB): | 21000 |
| JVM Maximum Heap (MB): | 21000 |
| JVM Address Bits: | 64 |
| Boot Firmware Version: | 2.00.25 |
| Management Firmware Version: | UIS-OM 1.00.10 |
| Workload Version: | SSJ 1.2.10 |
| Director Location: | Controller |
| Other Software: | Microsoft Windows KB3021910, clearcompressionflag.exe, KB2919355, KB2932046, KB2959977, KB2937592, KB2938439, KB2934018, KB4056898, patched to this test system in May 6, 2019 |
| JVM Instance | ssj_ops@100% |
|---|---|
| WIN-SUT104.001 | 1,415,804 |
| WIN-SUT104.002 | 1,412,811 |
| WIN-SUT104.003 | 1,415,224 |
| WIN-SUT104.004 | 1,422,438 |
| ssj_ops@100% | 5,666,277 |
| ssj_ops@100% per JVM | 1,416,569 |

| Target Load | Actual Load | ssj_ops | |
|---|---|---|---|
| Target | Actual | ||
| Calibration 1 | 1,420,293 | ||
| Calibration 2 | 1,418,693 | ||
| Calibration 3 | 1,420,662 | ||
| ssj_ops@calibrated=1,419,677 | |||
| 100% | 99.7% | 1,419,677 | 1,415,804 |
| 90% | 90.0% | 1,277,710 | 1,277,585 |
| 80% | 80.0% | 1,135,742 | 1,135,213 |
| 70% | 70.0% | 993,774 | 993,724 |
| 60% | 60.0% | 851,806 | 851,217 |
| 50% | 50.0% | 709,839 | 709,303 |
| 40% | 40.1% | 567,871 | 568,641 |
| 30% | 30.0% | 425,903 | 425,684 |
| 20% | 20.0% | 283,935 | 284,125 |
| 10% | 9.9% | 141,968 | 140,935 |
| Active Idle | 0 | 0 | |

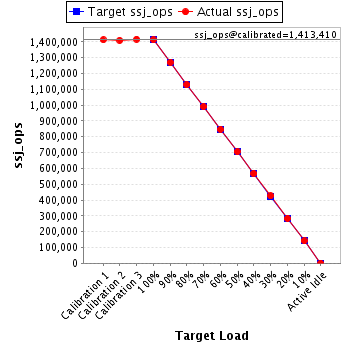
| Target Load | Actual Load | ssj_ops | |
|---|---|---|---|
| Target | Actual | ||
| Calibration 1 | 1,412,353 | ||
| Calibration 2 | 1,409,720 | ||
| Calibration 3 | 1,417,099 | ||
| ssj_ops@calibrated=1,413,410 | |||
| 100% | 100.0% | 1,413,410 | 1,412,811 |
| 90% | 89.9% | 1,272,069 | 1,271,169 |
| 80% | 79.9% | 1,130,728 | 1,129,095 |
| 70% | 70.1% | 989,387 | 990,512 |
| 60% | 60.0% | 848,046 | 847,664 |
| 50% | 49.9% | 706,705 | 705,004 |
| 40% | 40.1% | 565,364 | 566,651 |
| 30% | 30.1% | 424,023 | 425,441 |
| 20% | 20.0% | 282,682 | 282,755 |
| 10% | 10.0% | 141,341 | 141,718 |
| Active Idle | 0 | 0 | |
| Target Load | Actual Load | ssj_ops | |
|---|---|---|---|
| Target | Actual | ||
| Calibration 1 | 1,417,816 | ||
| Calibration 2 | 1,416,645 | ||
| Calibration 3 | 1,415,977 | ||
| ssj_ops@calibrated=1,416,311 | |||
| 100% | 99.9% | 1,416,311 | 1,415,224 |
| 90% | 90.0% | 1,274,680 | 1,274,653 |
| 80% | 79.8% | 1,133,048 | 1,130,916 |
| 70% | 70.1% | 991,417 | 992,269 |
| 60% | 59.9% | 849,786 | 849,034 |
| 50% | 49.9% | 708,155 | 706,666 |
| 40% | 40.0% | 566,524 | 566,771 |
| 30% | 30.0% | 424,893 | 424,289 |
| 20% | 20.1% | 283,262 | 284,359 |
| 10% | 10.1% | 141,631 | 142,575 |
| Active Idle | 0 | 0 | |

| Target Load | Actual Load | ssj_ops | |
|---|---|---|---|
| Target | Actual | ||
| Calibration 1 | 1,425,919 | ||
| Calibration 2 | 1,423,682 | ||
| Calibration 3 | 1,424,463 | ||
| ssj_ops@calibrated=1,424,072 | |||
| 100% | 99.9% | 1,424,072 | 1,422,438 |
| 90% | 90.1% | 1,281,665 | 1,282,727 |
| 80% | 80.2% | 1,139,258 | 1,142,806 |
| 70% | 70.1% | 996,851 | 997,616 |
| 60% | 59.9% | 854,443 | 852,665 |
| 50% | 50.1% | 712,036 | 712,763 |
| 40% | 40.0% | 569,629 | 569,002 |
| 30% | 30.1% | 427,222 | 428,775 |
| 20% | 19.9% | 284,814 | 284,004 |
| 10% | 9.9% | 142,407 | 141,431 |
| Active Idle | 0 | 0 | |
